How Burn-Down Trend Evaluation Exposes Hidden Project Delays Before They Crisis-Correct Your Career
ATTENTION: The Hook and Corporate Reality
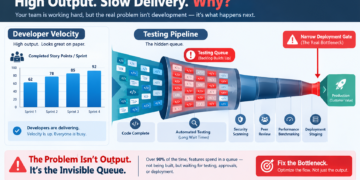
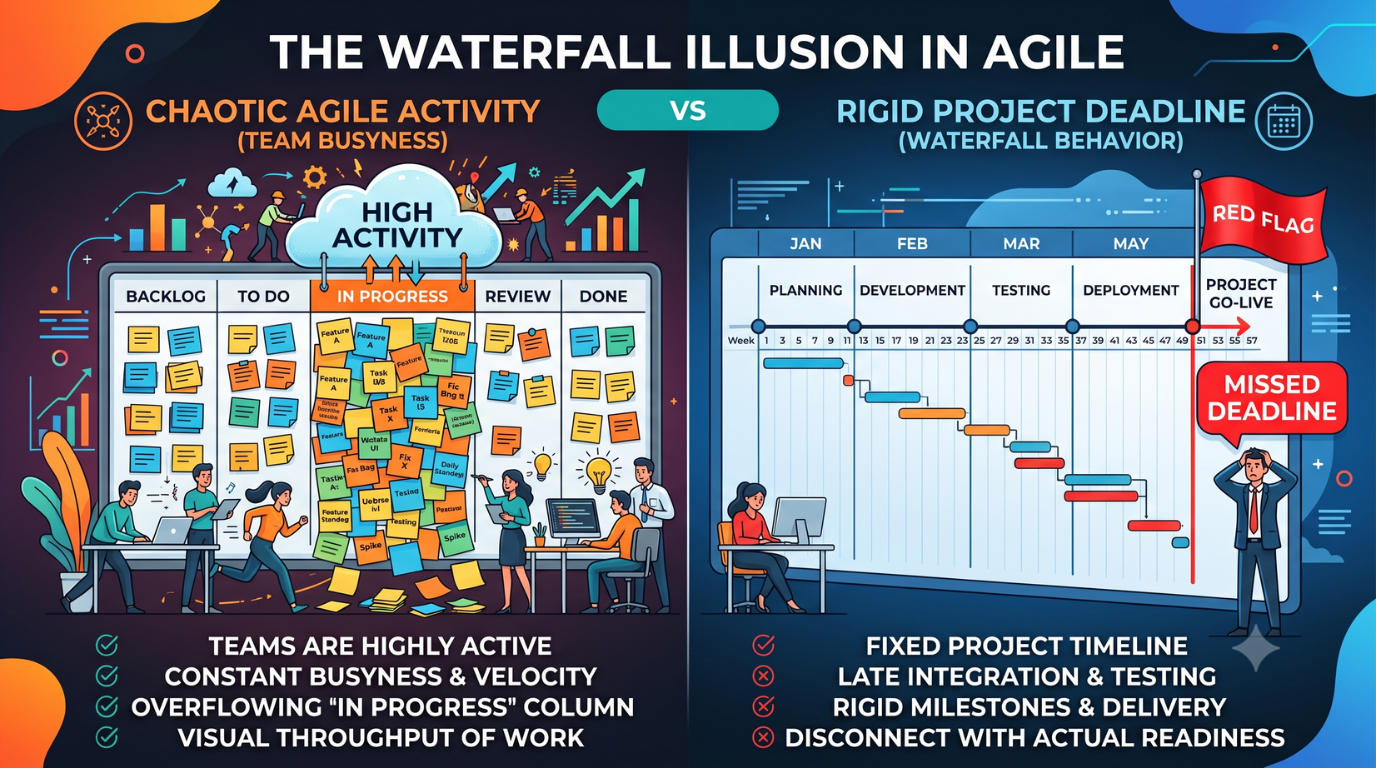
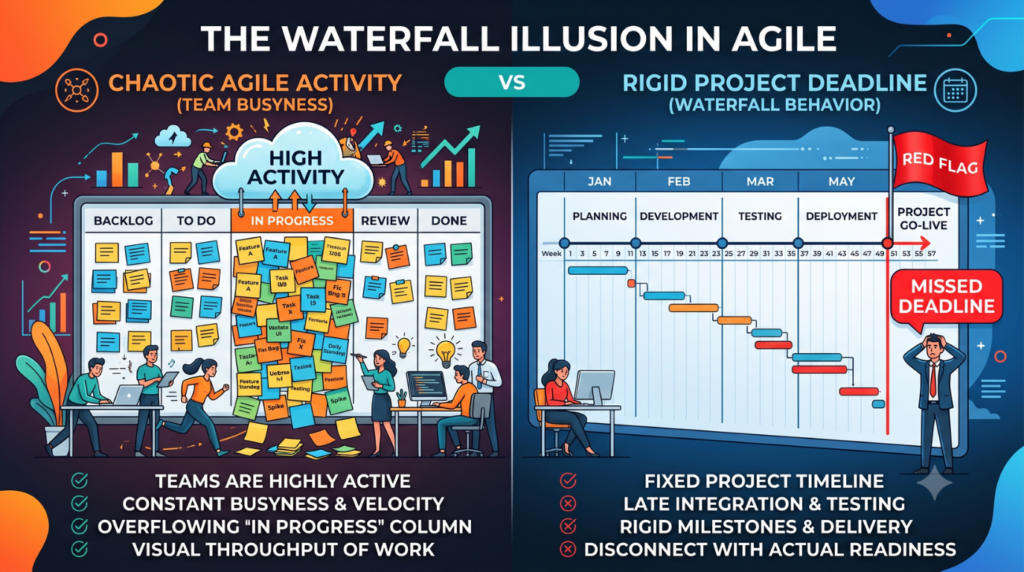
It is 11:45 PM on a Thursday evening, exactly two days before a high-stakes enterprise platform release. The engineering team has been ordering office takeout for two weeks straight. The digital tracking board looks beautifully active, overflowing with sub-tasks labeled in progress, and the daily standup syncs have been filled with high-energy updates about heroic coding breakthroughs. Yet, as the Head of Delivery sits down to compile the executive release readiness report, a terrifying realization sets in. Despite the massive operational output, the project is mathematically impossible to deliver on time. The remaining scope is too heavy, the team velocity is too shallow, and the deadline is dead on arrival.
This is the classic corporate illusion: mistaking frantic activity for true progress. Far too many fast-moving business-to-business (B2B) organizations suffer from this painful operational blind spot. Leaders assume that because an engineering or product team is pulling maximum hours and clearing tickets, the initiative must be moving forward in a healthy state.
There is a destructive corporate myth that continues to circulate within product management departments: the belief that a highly active workflow board and an exhausted engineering team naturally translate to on-time product delivery. This single misconception routinely sinks high-stakes corporate initiatives and destroys the credibility of otherwise brilliant project managers. In reality, a development team can be burning massive amounts of cognitive energy while spinning its wheels on low-priority tasks, dealing with invisible architecture blockers, or drowning under undocumented scope changes. Without a rigorous, objective metric to evaluate real-time performance over a fixed timeline, project leaders remain completely blind to systemic delays until it is far too late to execute remediation protocols.
To break free from this exhausting cycle of reactive crisis management, elite agile organizations rely on a specific analytical discipline: Burn-Down Trend Evaluation. This advanced performance tracking methodology shifts the focus of project health from subjective team updates to objective, data-driven mathematical trajectories.
INTEREST: The Deep-Dive and Core Education
To properly implement agile performance tracking, project leaders must move past superficial progress indicators and master the science of trend evaluation. At its core, a burn-down chart is a visual mechanism that tracks remaining work points against a linear time baseline. Rather than celebrating what has already been completed, a burn-down chart forces corporate project teams to look directly at the remaining scope of work, providing an unvarnished, transparent view of the delivery runway.
The exceptional power of this tracking methodology lies in its juxtaposition of two distinct metrics: the linear baseline and the actual trend trajectory.
Demystifying the Linear Baseline
The linear baseline, often referred to as the Ideal Trend Line, represents the steady, consistent rate of work consumption required to complete the total scope of work within a fixed period. This line is drawn diagonally from the total estimated work points at the beginning of a milestone or sprint, down to zero at the scheduled completion date.
This linear baseline serves as an unyielding benchmark. It does not account for human emotion, development friction, or shifting corporate priorities. It simply states what must occur mathematically to fulfill the project commitment on schedu
Evaluating the Actual Trend Trajectory
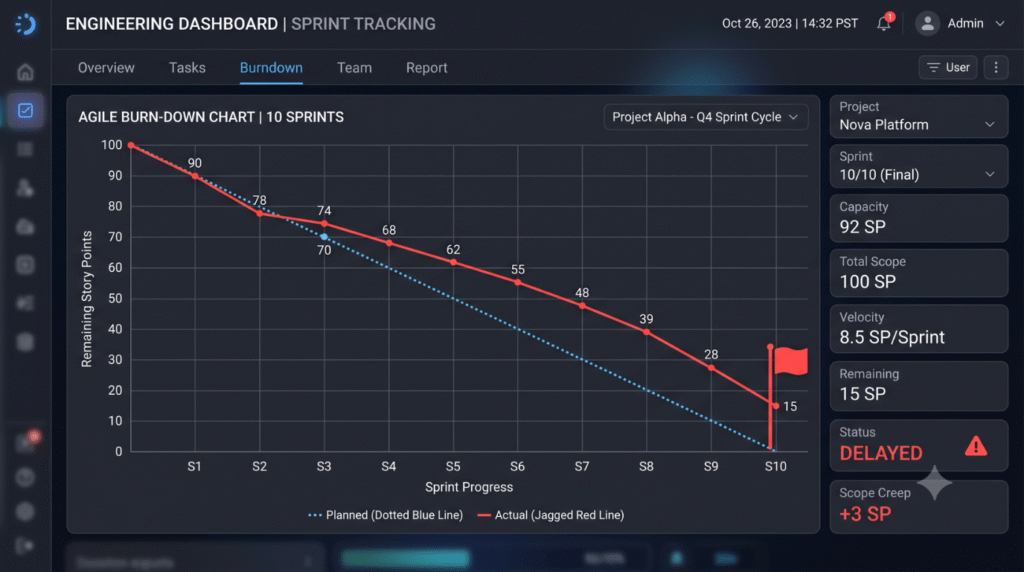
In real-world enterprise software development, project delivery rarely occurs in a perfectly straight line. The Actual Trend Line plots the real-time sum of remaining story points in the backlog repository at the end of each tracking interval. By plotting the remaining points directly against the unbending linear baseline, a project manager can evaluate the performance health of the delivery team instantly.
When the Actual Trend Line floats above the linear baseline, it serves as an undeniable mathematical warning flag that the project is running delayed. The team is simply not consuming the backlog points at a quick enough velocity to meet the deadline. Conversely, when the line dips below the baseline, it indicates that the team is tracking ahead of schedule, potentially freeing up valuable corporate capacity for advanced security testing, documentation refinement, or early customer validation phases
The Actionable Implementation Framework for Project Managers
Executing a successful trend evaluation strategy requires more than setting up an automated dashboard chart in an agile management software suite. It demands a systematic framework for reading, interpreting, and addressing the variances displayed on the trend line. Below is the step-by-step corporate protocol for implementing rigorous burn-down trend evaluations.
Step 1: Establish a Standard Unit of Measurement
Before a chart can be drawn, the project manager must align the cross-functional team on a precise estimation technique. The industry standard relies on the Fibonacci sequence or modified t-shirt sizing mapped to numerical story points in the database. This step ensures that the vertical axis of the chart measures relative complexity and effort rather than variable raw hours, maintaining baseline integrity across different engineering skill levels.
Step 2: Plot the Linear Decay Vector
Calculate the initial backlog volume and divide it by the planned milestone duration. Map this vector across the horizontal axis, which should be divided into fixed units of time: days for individual sprint tracking, or sprints for macroscopic release tracking. This line must remain fixed unless a formal corporate scope change is approved by the steering committee.
Step 3: Conduct Interval Data Captures
At the exact conclusion of every tracking interval, update the remaining work points in the project repository. Ensure that partial progress on uncompleted items is strictly excluded from the calculation. In elite delivery environments, an item is either completely done according to the formal Definition of Done, or its entire point value remains in the remaining work column. This binary approach prevents artificial deflation of the trend lin
Step 4: Run the Variance Trend Analysis
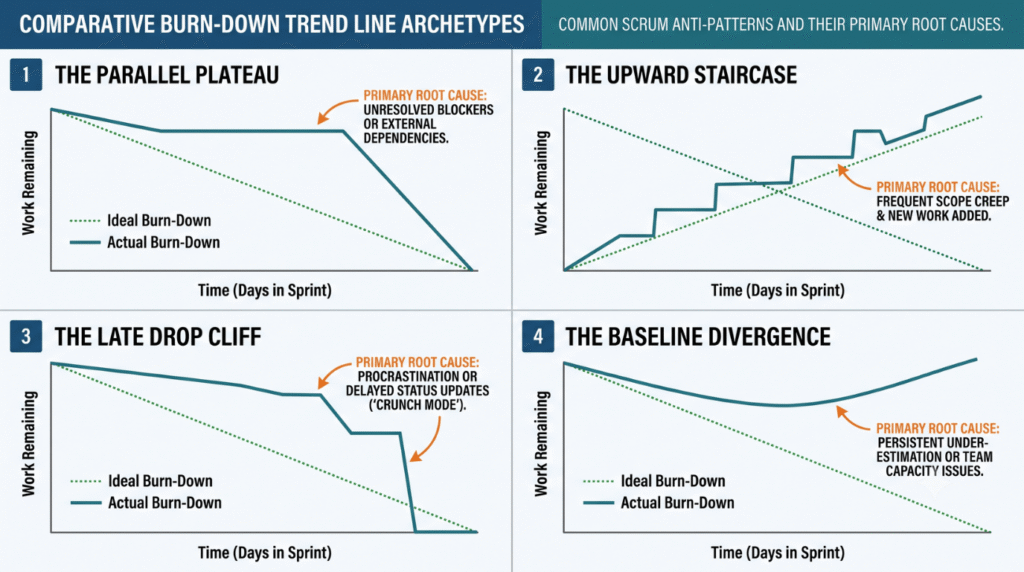
Do not make major project decisions based on single-day or single-sprint anomalies. Instead, analyze the trajectory over a trailing three-interval period. Project leaders should categorize the trend lines into four classic industry archetypes, outlined in the table below:
| Trend Line Archetype | Visual Pattern | Root Cause Diagnosis | Required Managerial Action |
|---|---|---|---|
| The Parallel Plateau | Actual line runs horizontally above the baseline. | The team is hit with an invisible blocker or accumulated technical debt. | Halt normal operations and resolve the architectural or technical impediment before continuing. |
| The Upward Staircase | Actual line spikes upward sharply in sudden steps. | Scope creep or poor initial requirement refinement has increased the backlog. | Re-negotiate feature scope with product owners immediately and re-establish project boundaries. |
| The Late Drop Cliff | Line remains flat until a sudden plunge near the end of the sprint. | The team is completing work but delaying status updates, causing inaccurate progress tracking. | Enforce real-time task updates and review progress during daily stand-up meetings. |
| The Baseline Divergence | Actual line moves progressively farther away from the ideal baseline. | Systematic overestimation, underestimated complexity, or reduced team capacity. | Conduct a root cause analysis, reassess team velocity, and update future sprint planning accordingly. |
Step 5: Execute Precision Remediation Protocols
Lorem ipsum dolor sit amet, consectetur adipiscing elit. Ut elit tellus, luctus nec ullamcorper mattis, pulvinar dapibus leo.
DESIRE: The Professional Transformation
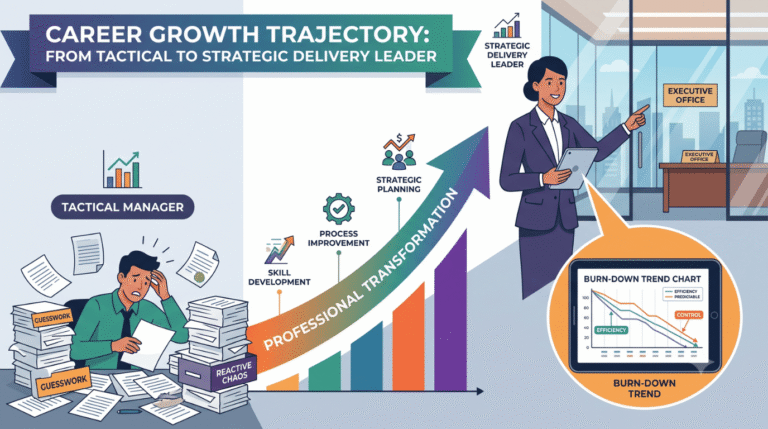
Mastering the math behind burn-down trend evaluation completely transforms a project manager’s day-to-day work experience. Imagine stepping permanently away from the daily anxiety of reactive project tracking. Instead of entering high-stakes stakeholder meetings wondering if the engineering team will deliver on its promises, you step up to the executive boardroom with total operational confidence. You possess an objective, early-warning metric system that flags delivery delays weeks before they manifest as operational failures.
When you implement performance tracking the correct way, you shift from a passive coordinator to an elite delivery leader. You no longer tell leadership teams that a release feels on track. Instead, you demonstrate, with clear trend vectors, exactly when a project will cross the finish line based on historical velocity and real-time backlog consumption.
This high-level visibility changes your relationship with stakeholder groups:
Data-Driven Scope Negotiations: When a corporate client requests an immediate feature addition, you do not guess at the operational impact. You plot the modification on the burn-down chart, showing how the upward staircase pattern delays the baseline release date. This visual demonstration changes the conversation from an emotional argument to a logical, numbers-based corporate choice.
Protection Against Team Burnout: By tracking performance health through a clear linear baseline, you can visually spot when a team is over-committing or working at an unsustainable pace. You gain the objective metrics needed to advocate for your engineers, keeping delivery timelines realistic and predictable.
Executive Visibility and Advancement: Corporate leadership values predictability above almost everything else. A professional who keeps timelines transparent, highlights delivery delays early, and applies framework-driven solutions is naturally tracked for rapid career progression.
Learning project management through data-driven methodology prepares you for complex, high-budget corporate programs. It moves your career past simply holding daily standups and places you directly into the realm of strategic asset management and operational excellence.
ACTION: The Skillsetify Brand Close
Averaging performance metrics and looking at beautiful, green status indicators will only take your career so far. The corporate landscape is crowded with practitioners who understand the basic terminology of agile but stumble when asked to deliver complex initiatives on a predictable timeline. True mastery requires looking deep into performance tracking metrics, understanding the variance between actual output and baseline expectations, and steering troubled projects toward a successful landing using clear, objective data.
Evaluating the trend lines on your burn-down charts is just the beginning of what it takes to manage projects at an elite level. To truly stand out in today’s competitive enterprise space, you must learn to navigate complex project zones with confidence and precision.
Take the Definitive Step in Your Professional Journey
If you are ready to stop guessing, move up the corporate ladder, and learn project management the right way, reach out to Skillsetify. We do not just teach frameworks: we show you your exact career growth trajectory. Our elite training solutions are designed specifically for ambitious leaders who want to master real-world execution, optimize delivery pipelines, and drive true corporate value. Do not let hidden delivery delays slow down your professional growth: partner with Skillsetify today to build your path toward corporate leadership.