Why Confusing Lead Time and Cycle Time Is Quietly Killing Your Delivery Velocity
Picture this board meeting. The Chief Commercial Officer slams his notebook on the conference table. An enterprise client paying seven figures annually is threatening to terminate their contract. Why? A critical software feature requested eight weeks ago has still not hit production.
The CCO turns to the Vice President of Engineering and demands an explanation. The VP of Engineering, looking baffled, opens Jira and pulls up the telemetry. He points directly to the board metrics: “I do not understand the outcry. Our engineering cycle time on that specific ticket was exactly 3.5 days. Our developers completed the work in record time!”
The room falls into tense silence. Both executives are looking at the exact same delivery pipeline, yet they are measuring two completely different realities.
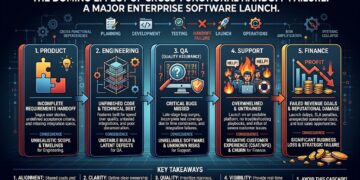
The feature spent 52 days sitting in an unrefined product backlog, waiting for design approvals, architecture sign-offs, and prioritization reviews. Once an engineer finally dragged the card to “In Progress,” the technical execution took under 84 hours.
To the customer and the CCO, delivery took 55 days. To engineering, it took 3.5 days.
This classic workplace meltdown stems from one of the most pervasive myths in modern corporate operations: To deliver faster, engineering teams simply need to write code faster.
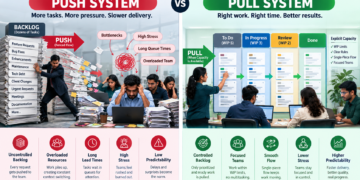
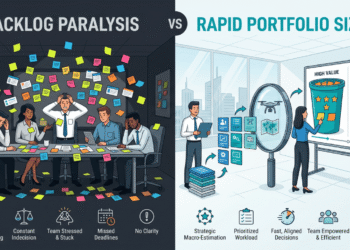
In reality, active technical execution accounts for less than 15% of the total duration a request spends inside an enterprise delivery system. The remaining 85% is dead time: work sitting idle in queues, blocked by cross-functional handoffs, or buried under unmanaged backlog piles. When leadership focuses exclusively on execution speed while ignoring system queues, they end up optimizing a tiny fraction of the process while the business bleeds client trust.

Deconstructing Performance Analytics: Lead Time vs. Cycle Time Defined
To diagnose delivery friction, set realistic SLAs, and eliminate client frustration, project managers and delivery leaders must explicitly differentiate between these two core metrics.
Lead Time: The Customer Experience Benchmark
Lead Time measures the total elapsed duration from the exact moment a work request is introduced into the system (or committed to by the team) to the moment it is fully delivered into the hands of the end user.
Perspective: External (Customer, Client, Business Stakeholder).
Clock Starts: When an item enters the backlog queue or receives formal intake commitment.
Clock Stops: When the deliverable is deployed, validated, and operational in production.
Key Components: Request intake delay + Queue waiting time + Active execution time + Deployment and verification time.
Primary Objective: Measures organizational responsiveness, value delivery, and market agility.
Cycle Time: The Operational Execution Benchmark
Cycle Time measures the duration spent actively working on a task once technical execution has officially begun. It reflects internal processing efficiency and team throughput.
Perspective: Internal (Engineering, QA, Technical Implementation Teams).
Clock Starts: When a team member pulls a task into “In Progress” or active work status.
Clock Stops: When technical work passes acceptance testing and reaches a “Done” or “Ready for Release” state.
Key Components: Active hands-on work duration + internal review and testing wait states.
Primary Objective: Measures process efficiency, technical stability, and execution capacity.
| Attribute | Lead Time | Cycle Time |
| Primary Focus | Total turnaround time from request to fulfillment | Operational execution duration for active work |
| Stakeholder Angle | Customer and Business Value viewpoint | Internal Team and Process Efficiency viewpoint |
| Formula | $Lead\ Time = Delivery\ Date – Request\ Intake\ Date$ | $Cycle\ Time = Work\ Completed\ Date – Work\ Started\ Date$ |
| Primary System Component | Dominated by queue time and waiting states | Dominated by active processing and immediate handoffs |
| Optimization Focus | Queue reduction and backlog refinement | Work-In-Progress (WIP) reduction and task simplification |
The Mathematical Engine: Little's Law and Workflow Mechanics
Understanding these metrics conceptually is only the first step. Elite project managers master the mathematical laws that govern workflow dynamics.
Little's Law in Modern Operations
Originating in queuing theory by MIT Professor John Little, Little’s Law provides the mathematical foundation for flow metrics in knowledge work. In a stable delivery system, the relationship between Work In Progress (WIP), Throughput, and Cycle Time is defined by the formula: