Why Infinite Capacity Is Strangling Your Project Throughput
Picture this familiar corporate nightmare. Your project board is overwhelmed with forty-seven active work items spread across various stages of development. Lead engineers are context-switching across four critical bugs simultaneously, designers are juggling three concurrent user experience revisions, and quality assurance engineers sit frozen under a massive, late-stage tidal wave of untested code. Stakeholders are aggressively demanding to know why a previously promised feature remains incomplete. In a frantic attempt to regain control, leadership dumps five new emergency priority tickets directly onto the team. After all, if everyone is working at maximum capacity, output must surely increase.
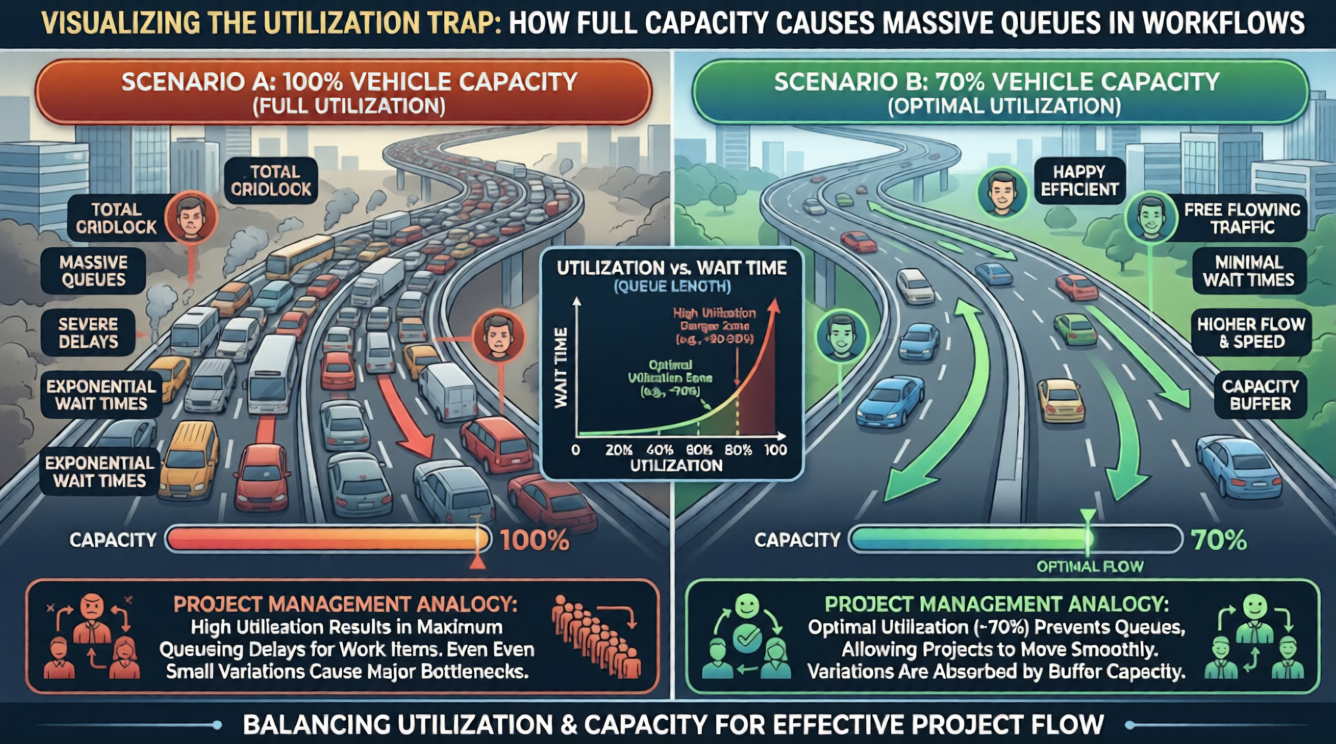
This is the most dangerous corporate myth in modern project management. The illusion that one hundred percent resource utilization equates to maximum efficiency is actively destroying your delivery timelines. Maximizing active tasks does not increase output. It simply creates a traffic jam in your workflow, leading to severe bottlenecks, team burnout, and a complete lack of predictability.
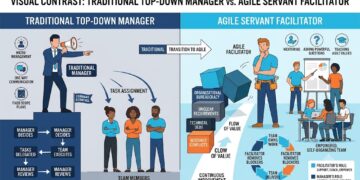
In a desperate bid to maintain control, many project managers resort to top-down management. They become glorified taskmasters, micromanaging daily assignments and pushing work onto their teams regardless of actual capacity. This push system is fundamentally broken. To evolve from a chaotic taskmaster into an elite workflow architect, you must fundamentally change how work moves through your system. You must stop starting new work and focus entirely on finishing active work. The ultimate mechanism for achieving this transformation is the strategic implementation of Work in Progress (WIP) limits.
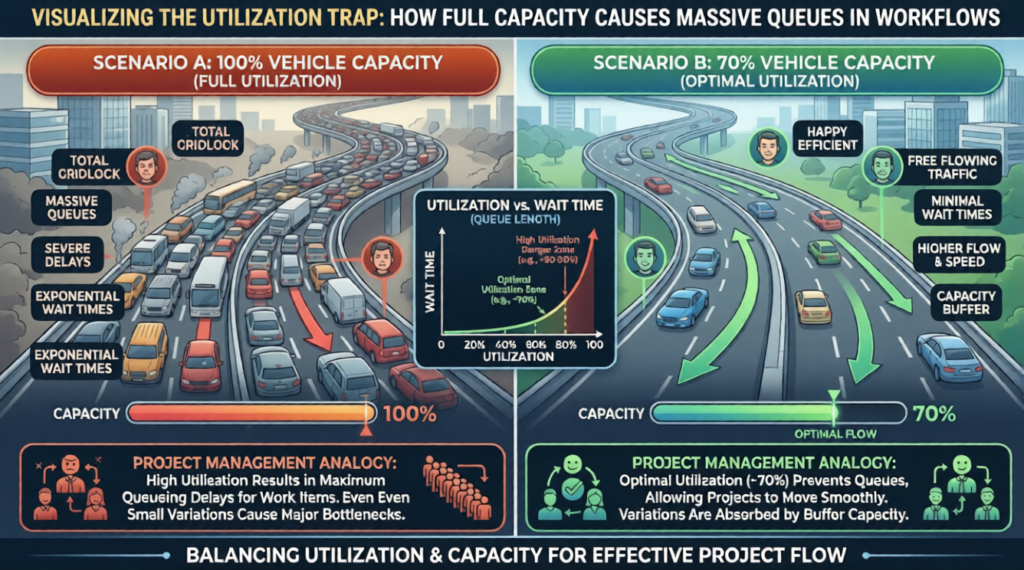
The Mechanics of Work in Progress (WIP) Limits
At its core, a Work in Progress limit is a strict numerical ceiling applied to specific columns within your visual board architecture. In systems like Kanban or Scrumban, a WIP limit explicitly dictates the maximum number of task cards that can exist in a given operational state at any single moment.
If a team sets a WIP limit of three on the “Active Development” column, team members are procedurally forbidden from pulling a fourth card into that column until one of the active three cards crosses the downstream boundary into “Code Review.”
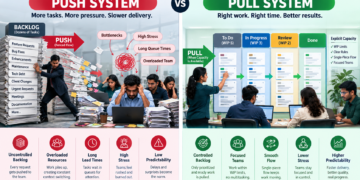
This numeric constraint forces a fundamental evolution in team behavior. It transforms a legacy “push” environment, where managers force work onto teams regardless of capacity, into a disciplined “pull” system. Under a pull protocol, new work is drawn into an operational stage only when explicit downstream capacity opens up.
Without WIP limits, visual project boards are little more than glorified to-do lists. Applying WIP constraints turns board architecture into an active diagnostic instrument that regulates flow, reduces context-switching waste, and exposes operational bottlenecks in real time.
The Mathematical Reality: Little's Law and Queueing Theory
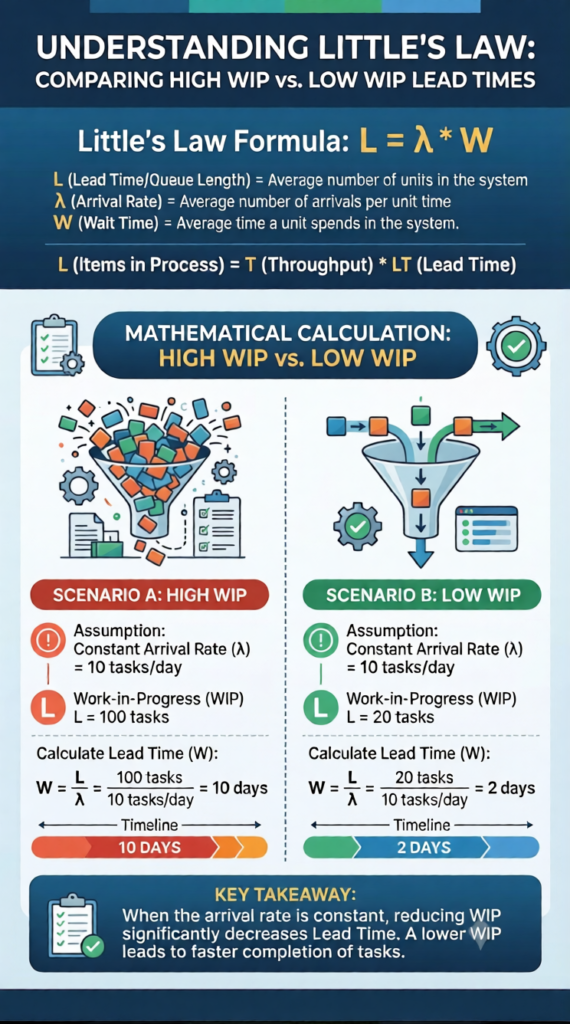
WIP limits are not merely managerial preferences. They are grounded in queueing theory and John Little’s mathematical theorem. Little’s Law establishes a proven mathematical relationship between three fundamental system variables in a steady-state delivery process:
Understanding WIP, Throughput, and Lead Time
Work in Progress (WIP), Throughput, and Lead Time are closely connected metrics that help project managers understand delivery speed and workflow efficiency.
Little's Law establishes the relationship between these three metrics:
To analyze delivery speed, the formula can be rearranged to isolate average Lead Time:
What Do These Metrics Mean?
- WIP (Work in Progress): Represents the average number of active items inside the workflow system.
- Throughput: Represents the average rate at which completed items exit the system per unit of time.
- Lead Time: Represents the total elapsed duration from task initiation to final delivery.
How WIP Affects Lead Time
The mathematical relationship has an important implication for project managers. If a team's average Throughput remains constant, increasing the average WIP increases the average Lead Time.
Reducing WIP can help shorten delivery times, particularly when excessive work creates queues, task switching, or delays. However, the relationship assumes that the workflow is reasonably stable and that the measured metrics represent the same system and time period.
Practical Example: Software Engineering Team
Consider a software engineering team with a historical completion rate (Throughput) of 5 user stories per week.
The team currently has 20 active items in its workflow.
Using Little's Law:
Under the assumptions of the model, the average Lead Time is 4 weeks.
What Happens When WIP Is Reduced?
Now, assume the team introduces stricter WIP limits and reduces the average number of active items from 20 to 5, while maintaining an average Throughput of 5 user stories per week.
The new Lead Time is calculated as follows:
Under the same assumptions, the average Lead Time decreases to 1 week.
Before and After WIP Reduction
| Metric | Before | After |
|---|---|---|
| Average WIP | 20 items | 5 items |
| Throughput | 5 items/week | 5 items/week |
| Average Lead Time | 4 weeks | 1 week |
| WIP Reduction | Baseline | 75% |
Key Takeaway for Project Managers
Reducing average WIP from 20 items to 5 items, while maintaining the same average Throughput, reduces the calculated average Lead Time from 4 weeks to 1 week.
This illustrates how controlling work in progress can improve delivery speed without requiring an increase in completion rate. In practice, teams must also consider bottlenecks, demand, work-item size, and whether the Throughput rate remains sustainable.
Exposing Bottlenecks and Driving Collaborative Swarming
WIP limits act as diagnostic alarm systems. When a specific column hits its capacity cap, upstream work halts immediately. For example, if the “Quality Assurance” column has a WIP limit of two and contains two active items, upstream developers are restricted from pushing completed code into QA.
In traditional organizations, blocked developers would simply pull new feature tickets from the backlog to remain active, further clogging the pipeline. Under strict WIP governance, starting new work is prohibited.
This operational boundary creates productive friction. When developers cannot start new tasks, they look downstream and ask how they can assist. This triggers a collaborative event known as “swarming.” Developers jump in to help run regression tests, fix QA environment configurations, or perform immediate peer reviews. Instead of managing individual output, team members actively collaborate to clear system impediments.
Building the Architecture: A Step-by-Step Implementation Framework
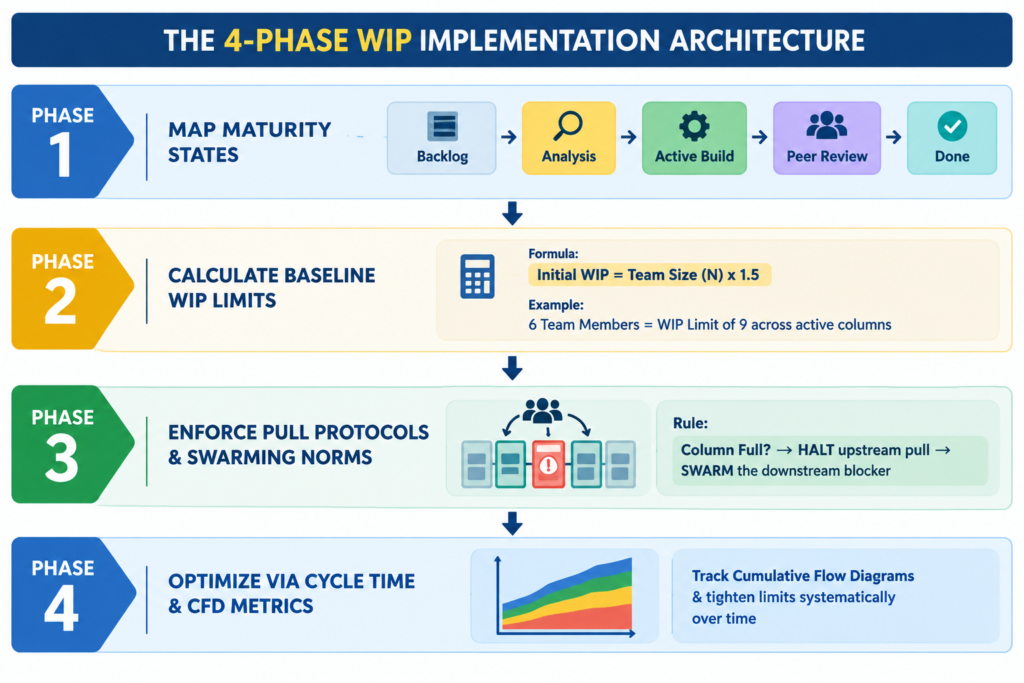
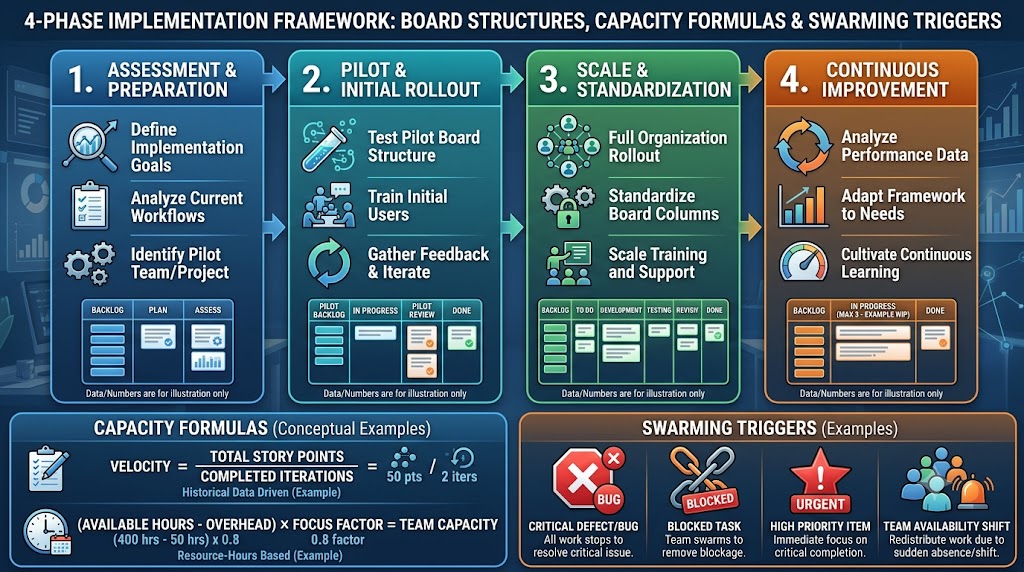
Implementing WIP limits requires deliberate system design and clear governance. Project managers can deploy this four-phase framework to transition teams into high-throughput execution.
Phase 1: Map Maturity States, Not Functional Silos
Structure your board architecture around value-add maturity states rather than functional job titles. Avoid generic columns like “Developer Tasks” or “Tester Tasks.” Instead, define clear operational boundaries:
Analysis & Definition: Story refinement and acceptance criteria validation.
Active Build: Hands-on development and implementation.
Peer Validation: Automated testing, code review, and quality checks.
Deployment Readiness: Staging staging verification and customer acceptance.
Phase 2: Calculate Baseline Limits Using Capacity Ratios
Do not impose overly restrictive limits on day one. Setting WIP limits too low initially can block flow before the team adapts. Establish your starting limits using a team size ratio formula:
Where N represents the number of dedicated team members assigned to that operational phase.
For a cross-functional pod of 4 developers, set the initial “Active Build” WIP limit to 6 cards (4 x 1.5 = 6). This provides a buffer for minor dependencies while establishing an explicit operational ceiling. As team collaboration matures, tighten this multiplier toward 1.0 or lower.
Phase 3: Enforce Strict Pull Protocols and Swarming Norms
Establish non-negotiable operational rules for board governance:
The Pull Rule: A team member may only pull a new card into a column if the current card count is strictly less than the designated WIP limit.
The Blocker Rule: If a column reaches its WIP limit, upstream work pauses. All available capacity must pivot to clear downstream bottlenecks.
The Buffer Policy: Queues between major operational states (such as “Ready for Review”) must carry independent, explicit WIP limits to prevent hidden inventory pileups.
Phase 4: Measure Cycle Time and System Stability
Track performance improvements using two key flow metrics:
Cycle Time: Measure the exact duration a task spends moving from “Active Build” to “Done.” As WIP limits take effect, average cycle time should decrease steadily.
Cumulative Flow Diagram (CFD): Monitor the vertical distance between state boundaries on your CFD. Parallel, narrow bands indicate a stable system with minimal WIP accumulation, while widening bands signal developing bottlenecks.
From Top-Down Taskmaster to Collaborative Mentor
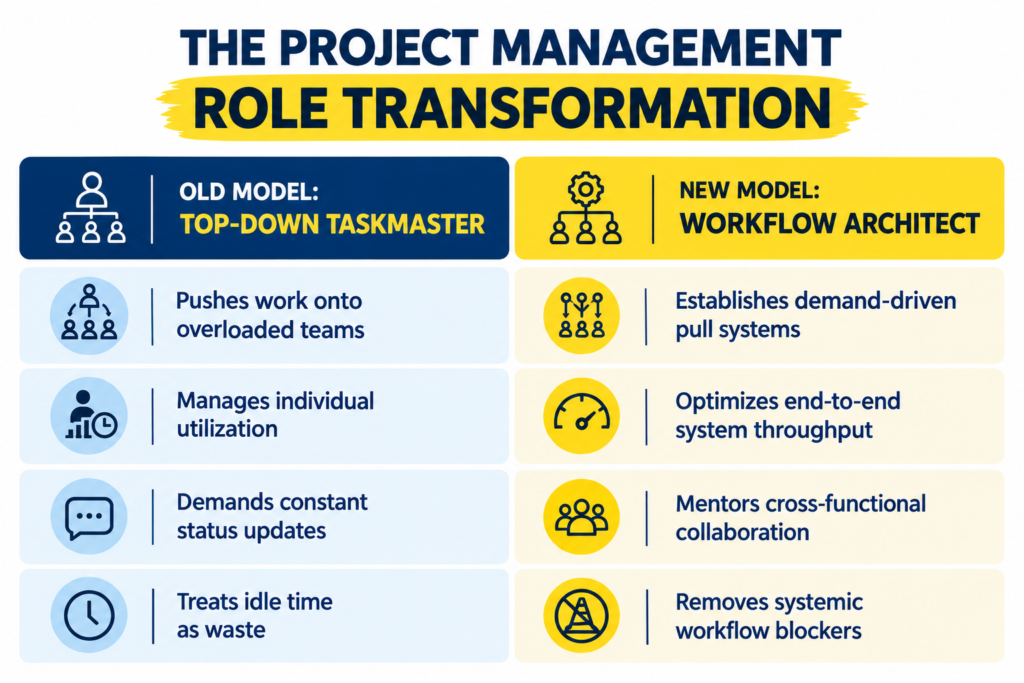
Enforcing WIP limits changes the fundamental role of the project manager. When you no longer spend your days manually assigning tickets, nagging team members for status updates, or reallocating schedules, you unlock the time needed for genuine delivery leadership.
Active Impediment Removal Over Direct Command
In a WIP-limited environment, bottlenecks are visually undeniable. When a column turns red, an elite project manager does not assign blame or demand overtime. Instead, you step in as a facilitator. You investigate root causes: Are acceptance criteria ambiguous? Is the staging environment unstable? Is technical debt slowing execution?
Your value shifts from tracking work to actively removing structural blockers. You protect the team’s operational boundaries from external stakeholder interference, ensuring they maintain a stable delivery rhythm.
Coaching Cross-Functional Capability
WIP constraints encourage team members to step outside rigid role definitions. When developers assist with testing or quality engineers review technical specifications, skill boundaries soften.
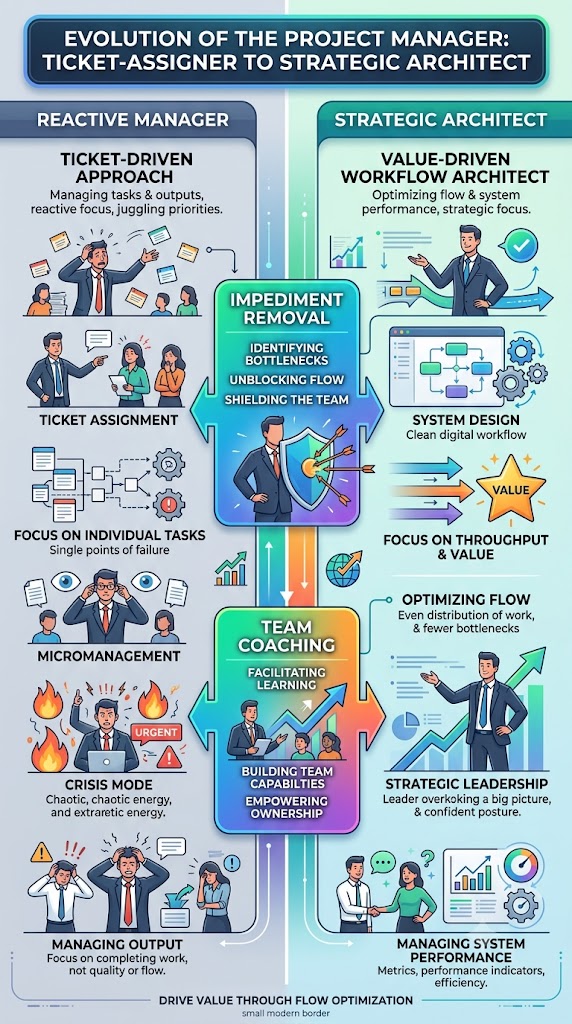
As a project leader, your job is to coach this cross-functional capability. You mentor senior specialists on how to share context with peers, helping build a resilient team capable of swarming any delivery bottleneck.
Accelerate Your Executive Career Trajectory
Mastering workflow architecture separates average project coordinators from high-value delivery leaders. Modern enterprises do not need administrative managers to update status spreadsheets. They demand strategic operations experts who can design predictable delivery engines, eliminate waste, and scale business output.
When you demonstrate the ability to stabilize team velocity, reduce feature lead times by fifty percent, and cultivate a culture of team ownership, you position yourself as an indispensable operational asset. You move from managing tactical tickets to leading strategic enterprise initiatives, paving a clear path toward senior management and executive portfolio leadership.
Systemic constraint is the secret to organizational speed. By establishing firm Work in Progress limits, you eliminate context-switching waste, expose workflow bottlenecks, and elevate your leadership style from top-down management to strategic facilitation. Stop starting, start finishing, and build the foundation for elite project delivery.
If you are ready to stop guessing, move up the corporate ladder, and learn project management the right way, reach out to Skillsetify. We do not just teach frameworks: we show you your exact career growth trajectory.