How Cumulative Flow Diagrams Reveal the Hidden Friction Killing Your Delivery Timelines
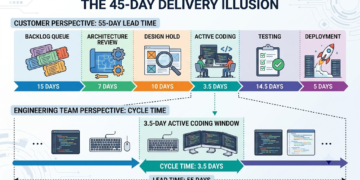
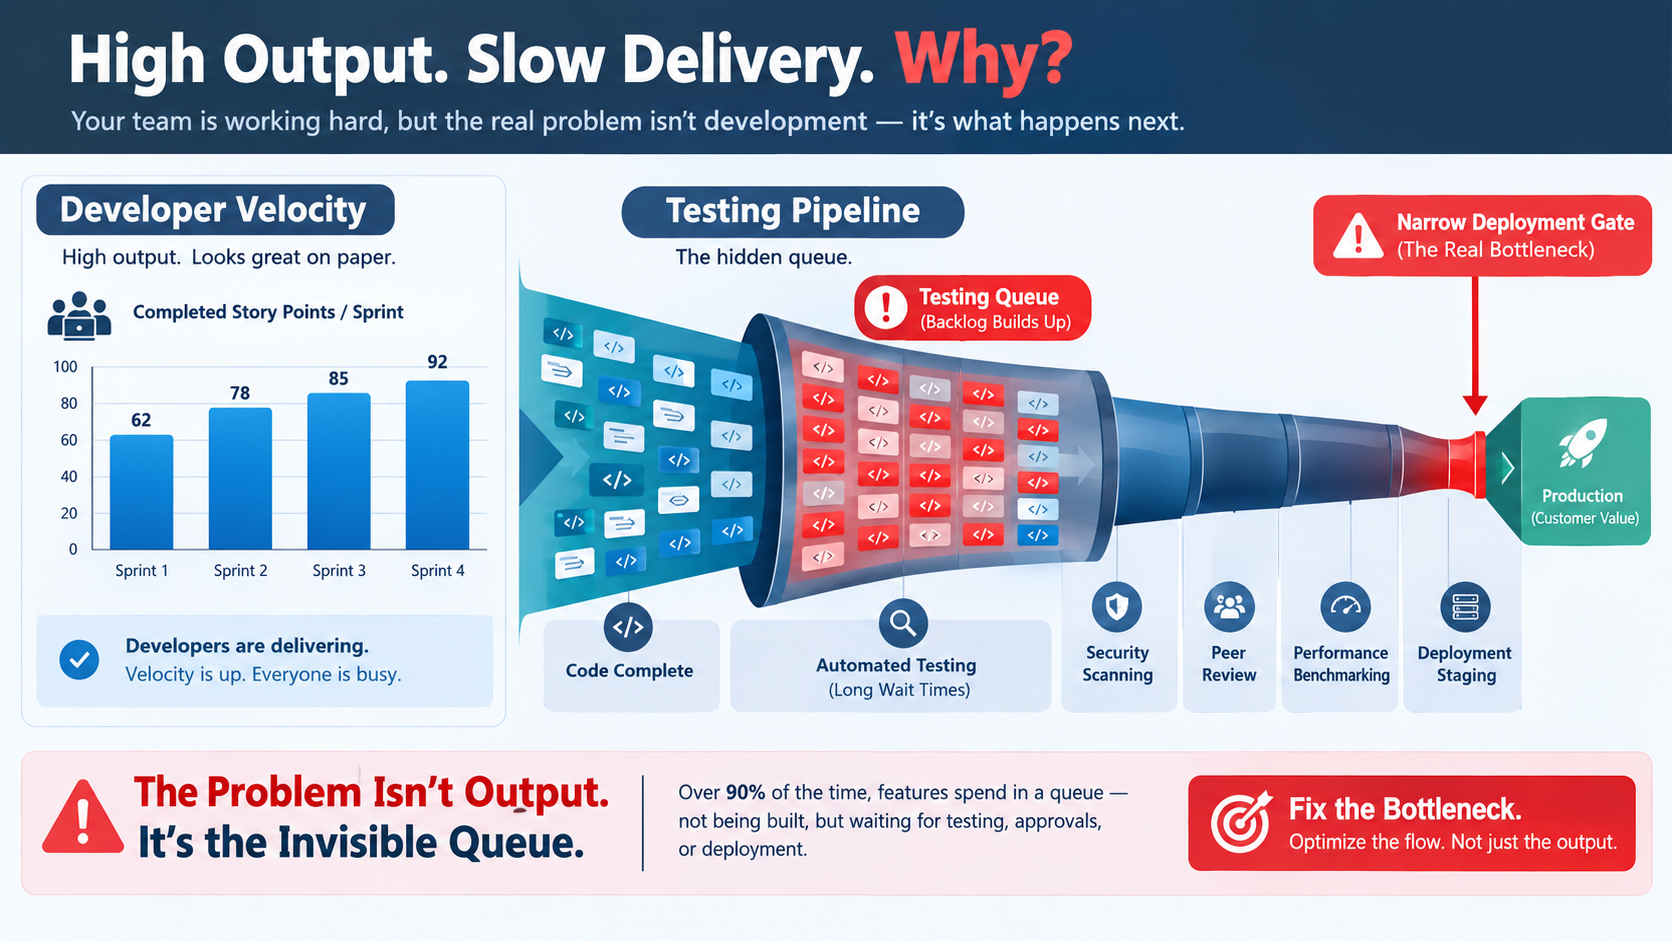
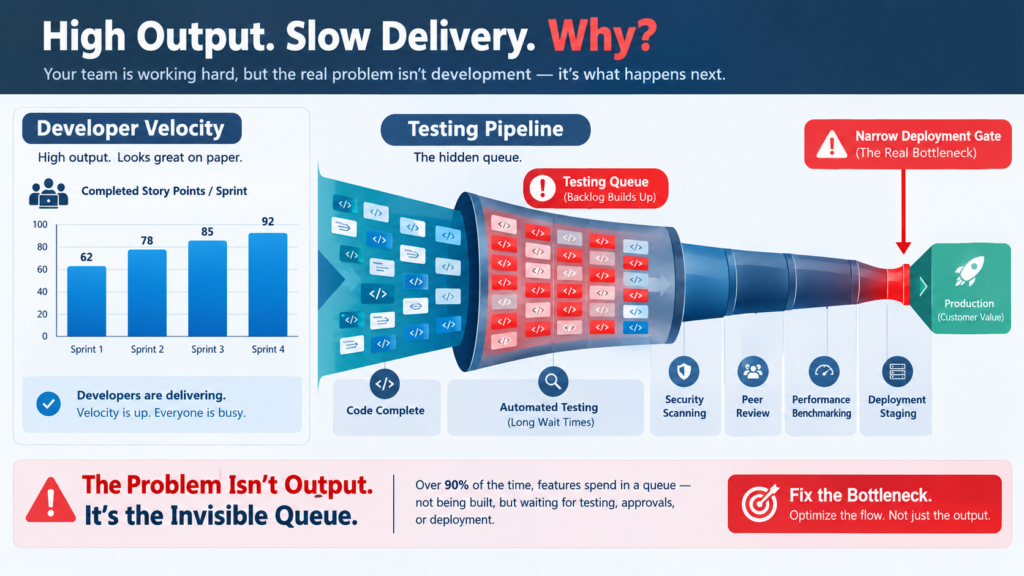
Your executive leadership team expects a business-critical enterprise software release to go live by midnight on Friday. For the past four weeks, developer velocity metrics looked stellar on the sprint burndown chart. The engineering team closed user story after user story, and story point velocity was at an all-time high. Yet, as the final delivery deadline looms, zero features have actually reached production.
The testing queue is severely overflowing. Quality Assurance engineers are working 14-hour days trying to validate dozens of accumulated builds. Critical defect fix loops are kicking tickets back and forth between development and testing. When the Vice President of Product asks a simple, direct question (“When will this release actually ship?”), no one in the room can provide a reliable answer. The project is officially in crisis, and morale is plummeting.
This stressful scenario plays out daily across major corporations. The common corporate myth is that project delays stem from slow execution or a lack of developer effort, leading executives to believe that the solution is simply to hire more engineers or mandate overtime. In reality, delivery teams rarely suffer from execution speed. They suffer from invisible queue accumulation and unmanaged Work In Progress (WIP).
Traditional burndown and velocity charts give project managers a false sense of security because they measure completed output rather than process flow. They mask where work is piling up until the deadline has already passed. To prevent delivery catastrophes, project leaders must stop relying on superficial vanity metrics and deploy the ultimate visual analytics tool: the Cumulative Flow Diagram (CFD).
Decoding the Cumulative Flow Diagram: Mechanics, Metrics, and Mathematical Reality
What is a Cumulative Flow Diagram?
A Cumulative Flow Diagram (CFD) is an advanced flow analytics visualization tool originating from Lean manufacturing and Kanban methodologies. Unlike static status reports or isolated sprint charts, a CFD tracks the accumulated total count of work items across every stage of a workflow over a continuous timeline.
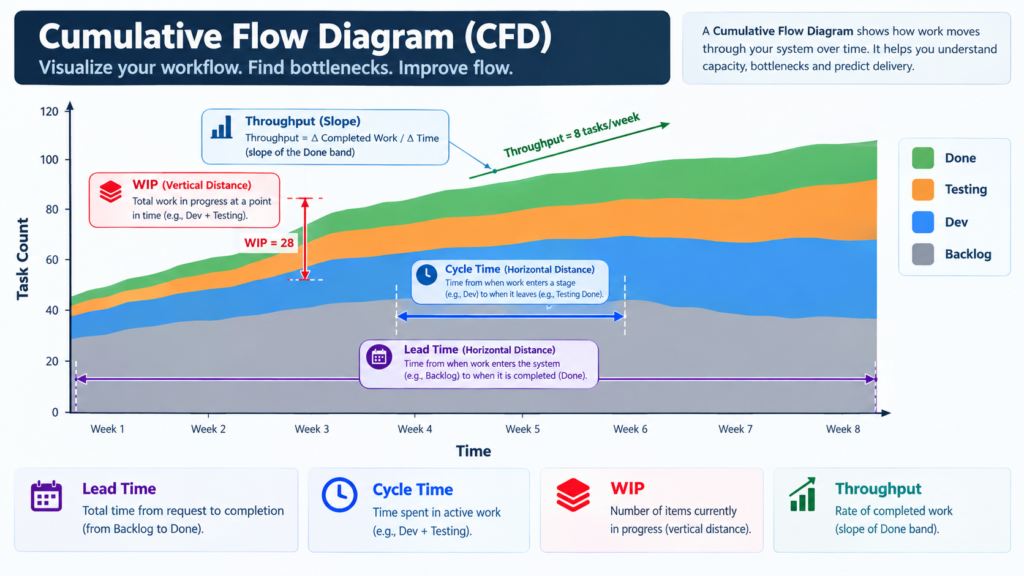
The horizontal axis (X-axis) represents time, typically tracked in days, weeks, or sprints. The vertical axis (Y-axis) represents the total cumulative number of work items that have entered the system. Each stage of your delivery board, such as Backlog, In Development, In Testing, and Done, is plotted as a distinct, color-coded band stacked vertically.
Because the metric is cumulative, the boundary lines on a CFD only move upward or run horizontally; they never slope downward. When new work items enter a stage, the top boundary line of that stage steps upward. As tasks move sequentially across columns, the band representing each column expands or contracts vertically based on the number of items currently sitting in that state.
The Core Flow Metrics Visualized in a CFD
A single, well-maintained CFD consolidates three foundational metrics of delivery performance:
Work In Progress (WIP): Represented by the vertical distance between the top boundary line and the bottom boundary line of any active state at a specific point in time. It measures the total volume of work currently clogging that specific stage of the pipeline.
Cycle Time vs. Lead Time:
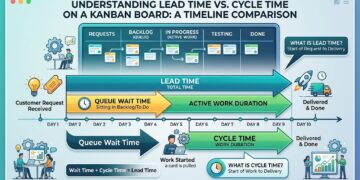
Lead Time: The total elapsed time from when a feature request is logged into the backlog to when it reaches “Done”. It is measured horizontally from the backlog arrival point to the completion line.
Cycle Time: The active elapsed duration from when work actually starts in development to when it is fully completed. It is measured horizontally from the “In Progress” boundary line to the “Done” boundary line.
Throughput: Visualized by the slope of the “Done” band. A steep upward angle represents high operational throughput and rapid task completion, whereas a flat slope indicates stagnating delivery.
Little's Law: The Physics of Workflow Management
The mathematical operational mechanics of a CFD are governed by Little’s Law, a core principle of queuing theory formulated by John D. C. Little in 1961:
This formula proves an undeniable operational law: if your team’s throughput capacity remains constant, increasing the number of active tasks directly inflates your cycle time. Pushing more work items into an already full system without expanding capacity does not yield faster results; it inflates lead times, increases context switching, and guarantees project delays.
Reading the Signals: Diagnostic Chart Patterns
Project managers must evaluate CFDs like medical diagnostic monitors. The geometric relationship between the stacked bands reveals the precise health of your operational pipeline:
Parallel Bands (Healthy, Predictable Flow): When the top and bottom boundaries of every workflow stage run parallel to one another, the arrival rate of tasks equals the departure rate. The system is stable, throughput is consistent, and delivery commitments are highly predictable.
Widening Bands (Process Bottlenecks): When a specific colored band expands vertically over time, tasks are entering that stage faster than they are leaving. For example, if the “Testing” band widens significantly while the “Development” line keeps climbing, developers are completing code faster than QA can test it. This widening band pinpoints a severe testing bottleneck.
Flat Lines (System Blockages): A completely horizontal, flat line across the “Done” stage indicates zero completed output over that time frame. Work is completely stalled upstream due to unresolved environmental dependencies, severe defect blocking, or unmanaged scope changes.
Narrowing Bands (Resource Starvation): When an active stage band shrinks rapidly, downstream teams are finishing work faster than upstream teams can supply it. This signals capacity underutilization or unbalanced resource allocation.
Step-by-Step Implementation Framework for Project Managers
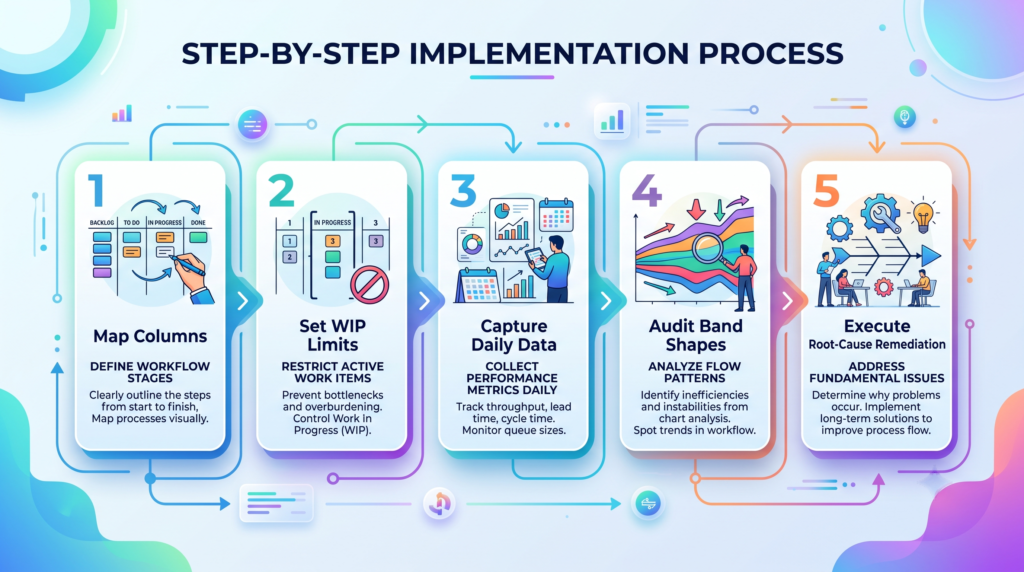
To transition your team to data-driven workflow management using Cumulative Flow Diagrams, follow this five-step execution framework:
Step 1: Map Explicit Workflow Columns
Standardize your board into distinct, sequential states that reflect reality (such as Backlog, Analysis, Development, Code Review, Testing, Deployment, Done). Ensure explicit “Definition of Done” criteria exist for transitioning items between columns to maintain data integrity.
Step 2: Establish Explicit Work In Progress (WIP) Limits
Define maximum capacity limits for every active workflow column based on team bandwidth. For example, if you have four developers, set a WIP limit of four active cards in “Development”. Enforce a pull system where team members cannot pick up new tasks from the backlog until an active item moves down the line.
Step 3: Capture Daily Cumulative State Data
Log the total cumulative count of work items present in each column at the end of every work day or week. Enterprise management tools like Jira, Azure DevOps, or Trello automate this data collection natively.
Step 4: Conduct Weekly Diagnostic Audits
During sprint retrospectives or team syncs, review the CFD’s band angles and widths. Look specifically for bulging bands or flat lines to catch emerging bottlenecks immediately, rather than waiting until the end of the delivery cycle.
Step 5: Execute Target Root-Cause Remediation
When a bottleneck is identified (such as a bulging testing column), intervene immediately. Reallocate developer capacity to assist with test automation, swarm on open defects, or adjust WIP limits upstream. For high-priority emergency tasks, establish a dedicated “Expedite” swimlane on your board to fast-track critical items without corrupting standard metric flow.
From Firefighting Chaos to High-Velocity Operational Leadership
Life Before vs. After CFD Mastery
Adopting Cumulative Flow Diagrams fundamentally transforms the daily reality of project management. The contrast between traditional intuition-based management and analytical flow control is stark:
Pipeline Visibility:
Traditional PM (Intuition & Velocity): Low visibility. Hidden queues surface only when deadlines are missed.
Advanced PM (Flow Analytics & CFDs): High visibility. Real-time visual detection of process bottlenecks.
Stakeholder Communication:
Traditional PM (Intuition & Velocity): Reactive explanations, friction, and missed launch dates.
Advanced PM (Flow Analytics & CFDs): Proactive, data-backed forecasting using Little’s Law.
Team Dynamics:
Traditional PM (Intuition & Velocity): High burnout, end-of-sprint crunch, and severe QA strain.
Advanced PM (Flow Analytics & CFDs): Sustainable pace, balanced workloads, and enforced WIP limits.
Delivery Predictability:
Traditional PM (Intuition & Velocity): Erratic velocity subject to sudden scope delays.
Advanced PM (Flow Analytics & CFDs): Smooth, repeatable throughput with minimal lead time variance.
Mastering performance analytics like Cumulative Flow Diagrams elevates a Project Manager from a tactical status recorder to a strategic operational leader. When presenting project updates to C-suite executives, you no longer offer vague status excuses. Instead, you present precise flow data showing exactly where systemic constraints live and how resource reallocations will optimize total organizational output.
Learning project management the right way requires stepping beyond superficial vanity metrics and embracing empirical queueing dynamics. This capability separates average project coordinators from elite Directors of PMO and VPs of Operations who consistently drive predictable enterprise outcomes.

Tracking accumulated tasks across board columns using Cumulative Flow Diagrams is single-handedly the most effective way to eliminate delivery guesswork, pinpoint testing delays, and establish predictable software releases. By visualizing WIP, controlling lead and cycle times, and balancing process capacity, you unlock elite performance and delivery stability.
If you are ready to stop guessing, move up the corporate ladder, and learn project management the right way, reach out to Skillsetify. We do not just teach frameworks: we show you your exact career growth trajectory.