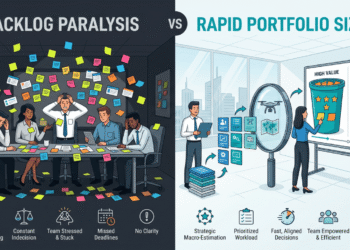
How to Convert Qualitative Agile Sizing into Hard Velocity Metrics
Just before the quarterly executive steering committee meeting, the Vice President of Product leans into the conference room and asks a critical question: “Can the engineering team ship the enterprise compliance module by the end of Q3?”
The Project Manager opens the team’s backlog board. Half the items are labeled “Medium,” three are tagged “Large,” and two are categorized as “Extra Large.” The PM stammers, attempting to convert clothing sizes into calendar dates on the fly. The VP frowns and asks: “Are we running a software organization or a retail department store?” The room goes silent.
This high-stress scenario plays out across corporate enterprises every single week. Delivery leaders adopt relative estimation frameworks to escape the notorious trap of hour-based estimates. However, they soon hit a wall when executive stakeholders demand deterministic forecasts, firm dates, and quantitative throughput metrics.
The prevailing myth in modern project management is that T-shirt sizing is purely qualitative and cannot be used for rigorous mathematical forecasting. Many practitioners believe that choosing T-shirt sizes means sacrificing velocity metrics entirely. That belief is fundamentally wrong. When implemented correctly, T-shirt sizing serves as a low-friction, human-centric interface built directly on top of a quantitative point system that powers precise velocity calculations.
The Architecture of Abstraction: Why T-Shirt Sizing Works
To understand why hybrid sizing models succeed, one must first understand human cognitive limitations. According to Hofstadter’s Law, tasks always take longer than expected, even when accounting for Hofstadter’s Law. When software engineers are forced to estimate complex work in absolute hours, cognitive friction rises. Engineers worry about unmodeled edge cases, code reviews, deployment pipelines, and unexpected bugs. This mental strain leads to estimation paralysis and highly inaccurate hour inflation.
Reducing Cognitive Load Through Visual Categorization
Human brains excel at relative comparison but struggle with absolute measurement. Comparing a Doberman to a Pomeranian is instantly intuitive: one dog is obviously significantly larger than the other. However, determining whether two German Shepherds differ in weight by 3 pounds requires careful measurement.
In software development, deciding whether a feature is “Medium” or “Large” requires far less mental energy than debating whether it will take 34 hours or 42 hours. By grouping work into distinct, non-numerical buckets, teams eliminate minor arguments over precise numbers and focus instead on broad orders of magnitude. This drastically reduces cognitive load during backlog refinement sessions, allowing teams to evaluate dozens of user stories in a fraction of the time.
The Dual-Layer Framework: Clothing Scale Backed by Numerical Points
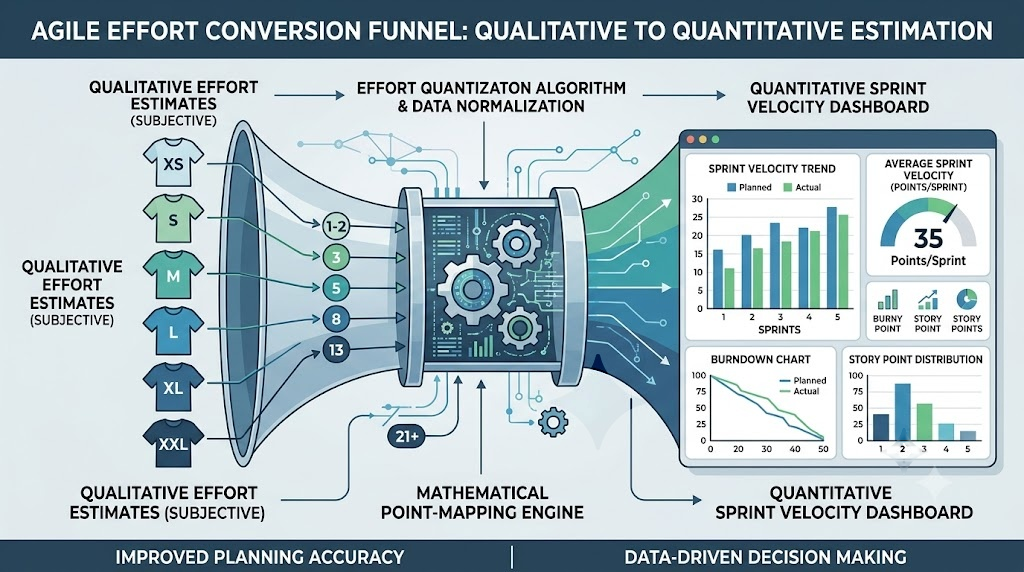
To maintain velocity tracking without reintroducing estimation anxiety, elite delivery teams implement a dual-layer sizing framework. The team interacts exclusively with the qualitative front end using familiar clothing identifiers: Extra Small (XS), Small (S), Medium (M), Large (L), Extra Large (XL), and Double Extra Large (XXL).
Behind the scenes, the project management system automatically maps each clothing identifier to an underlying numerical value based on a modified Fibonacci scale. This mapping translates human intuition into clean data that powers burn-down charts, capacity planning, and velocity tracking.
| T-Shirt Scale Identifier | Underlying Point Value | Complexity & Risk Profile | Standard Reference Benchmark |
| Extra Small (XS) | 1 Point | Minimal complexity, trivial code change, zero external risk. | Updating static text copy on an internal admin page. |
| Small (S) | 2 Points | Low complexity, well-understood logic, isolated component. | Adding a standard email regex validation to a login form. |
| Medium (M) | 5 Points | Average complexity, multi-file changes, standard architectural pattern. | Building a standard user authentication API endpoint. |
| Large (L) | 8 Points | High complexity, cross-system impact, multiple internal dependencies. | Developing an interactive CSV data export dashboard. |
| Extra Large (XL) | 13 Points | Very high complexity, significant risk, third-party integration required. | Migrating a legacy database table to a microservice architecture. |
| Double Extra Large (XXL) | 21 Points | Architectural epic, extreme uncertainty, unknown technical dependencies. | Building a real-time global multi-currency payment gateway. |
The Step-by-Step Implementation Guide for Project Leaders
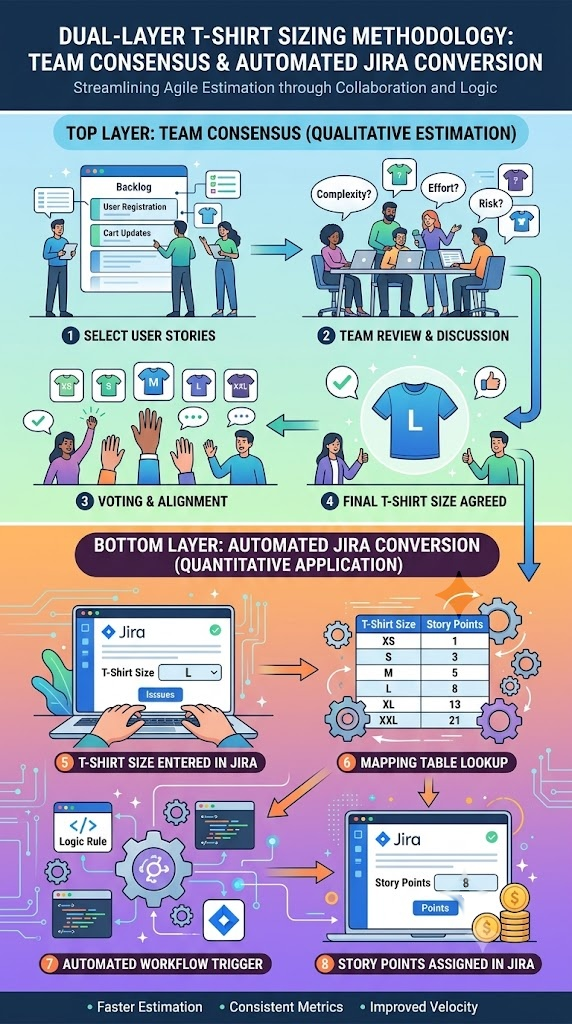
Rolling out this hybrid sizing framework requires clear governance. Project Managers can copy and execute this step-by-step implementation protocol immediately:
Step 1: Establish the Baseline Reference Item
Before estimating new work, select a completed, thoroughly understood historical user story from a past iteration. Formally categorize this story as your team’s baseline “Medium” (5 Points). All future work items will be evaluated relatively against this anchor item.
Step 2: Configure Automated Platform Mapping
Configure your enterprise workflow software (such as Jira, Azure DevOps, or Linear) to handle point conversion automatically. Set up a background rule: whenever a user selects “T-Shirt Size = M”, the system automatically assigns an underlying value of 5 story points to the item. The engineering team only sees the T-shirt label, while management dashboards consume the numerical point value.
Step 3: Facilitate Blind Consensus Voting
During backlog refinement, use planning poker or hidden digital voting tools. Read the acceptance criteria for a user story and prompt every team member to cast their vote simultaneously. Simultaneous revelation prevents senior developers or vocal team members from inadvertently biasing the rest of the team.
Step 4: Resolve Outliers Through Targeted Discussion
If three developers vote “Small” and one developer votes “Extra Large,” do not average the scores. Instead, invite the extreme voters to explain their reasoning:
Ask the “Extra Large” voter what hidden technical risks, database constraints, or security dependencies they identified.
Ask the “Small” voter if they know of an existing internal API or open-source package that solves the problem easily.
Once the team shares knowledge and reaches a consensus, finalize the T-shirt label.
Step 5: Enforce Epic Decomposition
If a user story receives an “XXL” (21 Points) rating, treat it as a signal to decompose the work. Large items carry exponential risk and high uncertainty. Mandate that any item rated “XL” or “XXL” be broken down into smaller “Medium” or “Small” child stories before entering sprint planning.
Calculating Team Velocity and Long-Term Forecasting
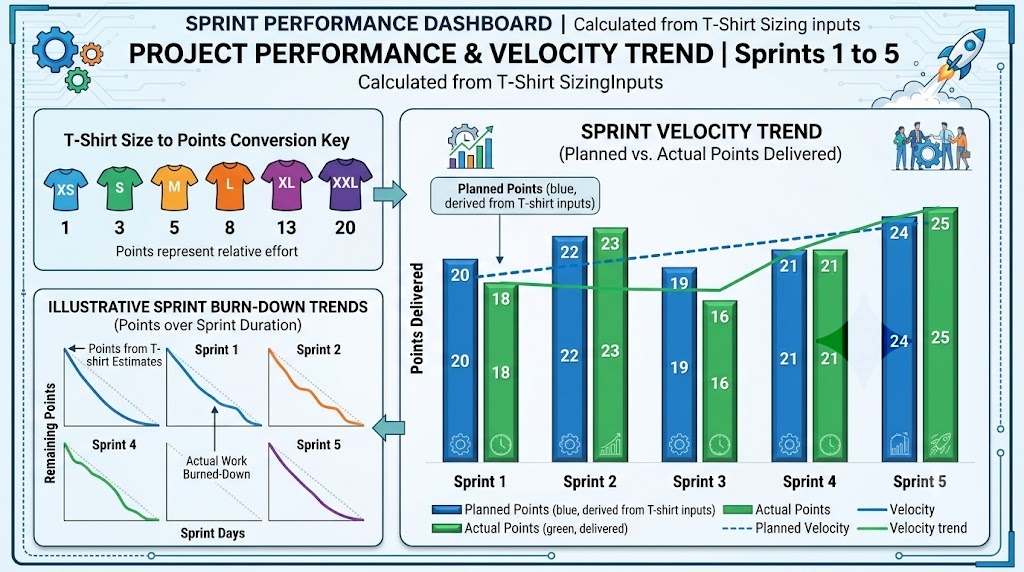
Once qualitative sizes convert into underlying point values, calculating team velocity becomes straightforward. Velocity represents the total number of completed underlying points delivered by a cross-functional team within a single sprint cycle.
To calculate the historical average velocity (\(V_{avg}\)) across \(n\) completed sprints, use the standard mathematical formula:
Where:
- \(V_{avg}\) = Historical average sprint velocity
- \(P_i\) = Total story points completed in Sprint \(i\)
- \(n\) = Number of completed sprints included in the calculation
Real-World Mathematical Scenario
Consider a software development team tracking their delivery performance across three consecutive two-week sprints:
Sprint Delivery Summary
Sprint 1 Delivery
- 2 Large items × 8 points = 16 points
- 2 Medium items × 5 points = 10 points
- 1 Small item × 2 points = 2 points
Sprint 2 Delivery
- 1 Extra Large item × 13 points = 13 points
- 2 Large items × 8 points = 16 points
- 1 Extra Small item × 1 point = 1 point
Sprint 3 Delivery
- 4 Medium items × 5 points = 20 points
- 6 Small items × 2 points = 12 points
To calculate the team's baseline velocity:
Deterministic Roadmap Forecasting
When executive stakeholders request a delivery timeline for an upcoming product epic estimated at 150 total story points, project leaders no longer need to rely on guesswork. Using the team's historical average velocity, you can calculate the exact number of required sprint cycles (\(S_{req}\)).
Given two-week sprint cycles, five sprints equal exactly ten weeks of calendar execution. This mathematical approach transforms vague qualitative estimates into clear, data-driven completion dates.
From Project Chaos to Executive Command
Implementing a dual-layer relative sizing framework completely transforms the delivery environment. Teams shift away from chaotic firefighting, unachievable deadlines, and team burnout, moving toward predictable, high-velocity delivery.
When product managers request new “Large” features mid-sprint, you can demonstrate the quantitative trade-off immediately: adding an 8-point item requires removing 8 points of equivalent work or extending the release date by half a sprint. This data-backed boundary protects engineering capacity while keeping trust high with senior leadership.
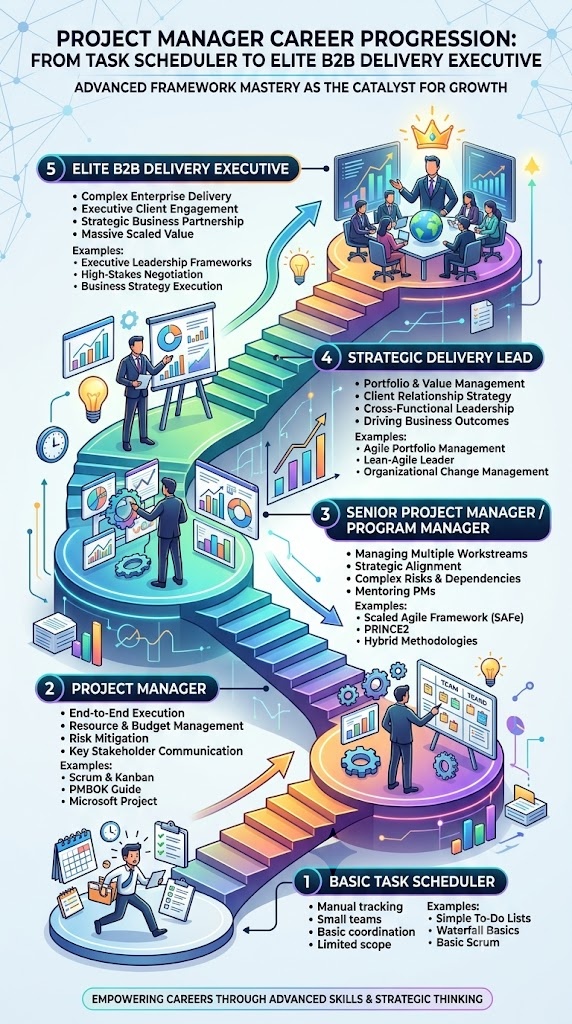
Mastering hybrid estimation, team velocity metrics, and governance frameworks elevates your standing in the organization. It shifts your career profile from a basic task tracker to a strategic delivery leader who commands executive respect and drives reliable business results.
Drive Your Career Forward with Skillsetify
Transitioning from basic project tracking to mathematically sound delivery governance requires hands-on execution mastery, expert guidance, and field-tested frameworks designed for enterprise environments.
If you are ready to stop guessing, move up the corporate ladder, and learn project management the right way, reach out to Skillsetify. We do not just teach frameworks: we show you your exact career growth trajectory.