Master Relative Estimation with Strategic Reference Scales
Imagine this scene: It is Monday morning. A critical enterprise release is scheduled for two weeks from today. Your principal software architect is locked in a heated debate with a senior product manager.
“This user authentication feature will take exactly 32 hours,” the architect insists.
“We do not have 32 hours,” the product manager counters. “Our developer has 24 hours of available capacity left this sprint. Trim eight hours out of the design.”
Fast forward three weeks. The feature is severely delayed, plagued by unforeseen integration edge-cases with third-party authentication APIs, and the team is completely burnt out from working back-to-back 14-hour days.
What went wrong? The team fell victim to one of the most persistent, expensive myths in modern corporate project delivery: the illusion that human beings can accurately estimate complex software knowledge work in absolute hours or days.
The Cognitive Trap: Why Absolute Time Estimations Fail
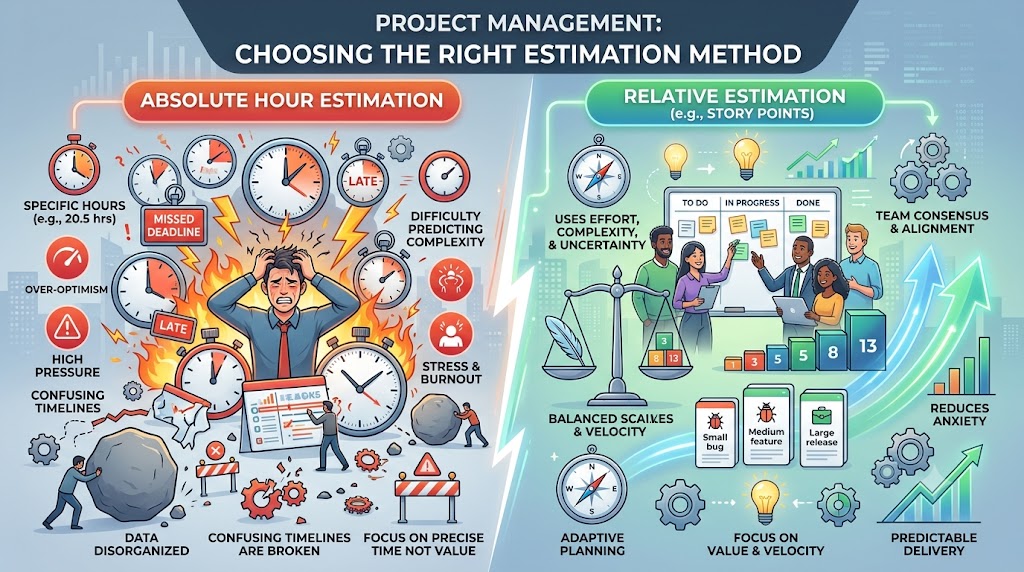
Human psychology is fundamentally ill-equipped to calculate absolute duration for complex, unprecedented tasks. When professionals attempt to estimate work in exact hours, they inherently assume an idealized environment: zero interruptions, instantaneous context switching, flawless technical dependencies, and perfect focus.
This cognitive bias leads to systemic underestimation and high operational risk.
The Mechanics of Relative Estimation
To solve the estimation crisis, high-performing B2B project teams abandon absolute duration in favor of Relative Estimation.
Relative estimation is the methodology of gauging the effort, complexity, and risk of a delivery item by comparing it directly against a known, established baseline, rather than measuring it against an arbitrary clock.
Instead of asking, “How many precise hours will this take?” an agile project team asks, “How big or complex is this work compared to our baseline reference item?”
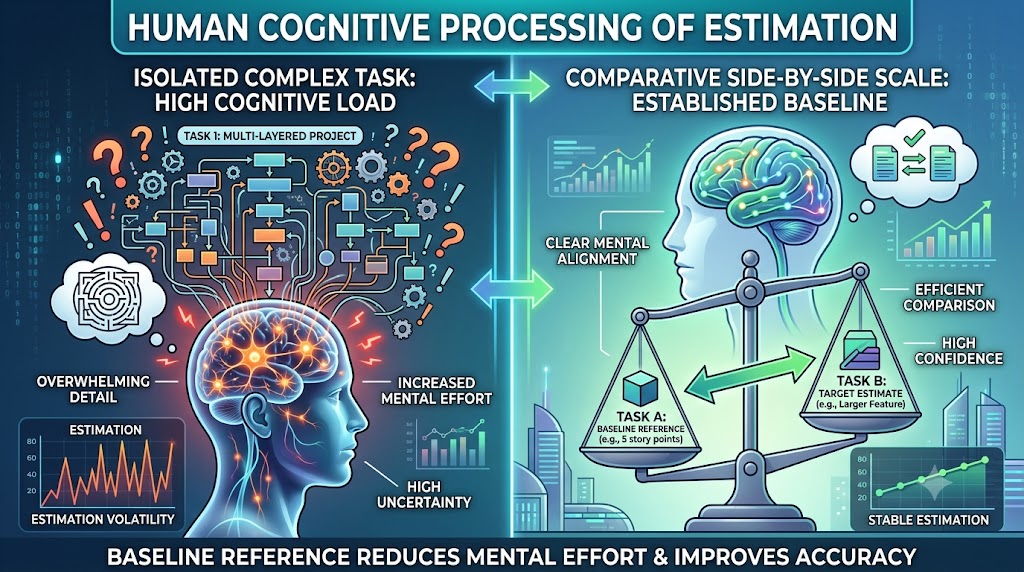
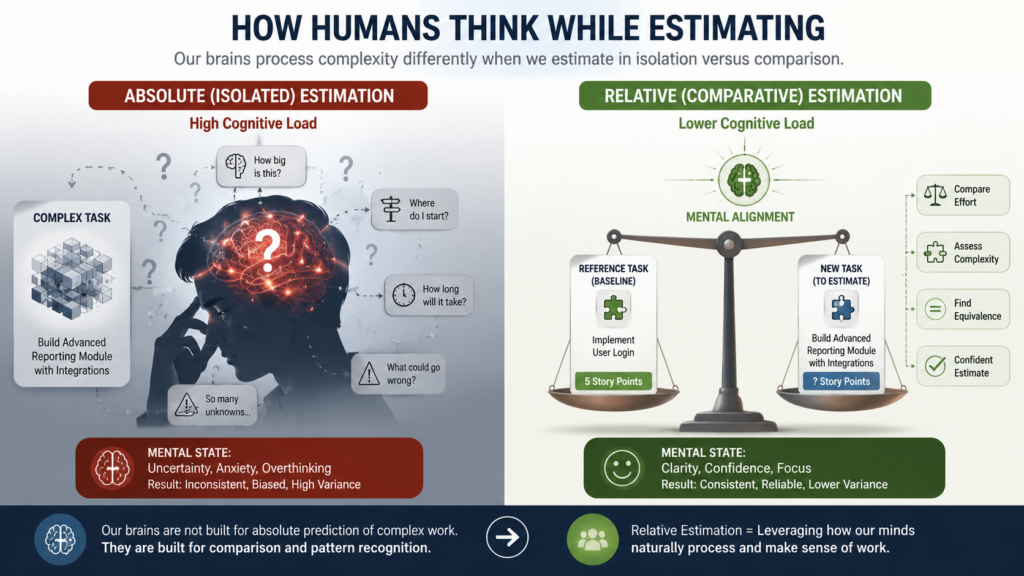
Human brains struggle with exact quantitative measurements in isolation, but excel naturally at spatial, comparative judgments.
The Comparative Brain: If you show someone two complex technical tasks, determining whether Task B is twice as difficult as Task A requires significantly less cognitive load than predicting whether Task B will take 27 or 34 clock hours.
Decoupling Capacity from Effort: Assigning effort units (such as Story Points) decouples the intrinsic difficulty of work from individual developer seniority, operational speed, or calendar availability.
Establishing Reference Scales
Anchoring Your Baseline
To execute relative estimation effectively, a team must construct a shared Reference Scale. Without a fixed reference point, asking a team whether a deliverable is “large” or “small” is meaningless.
What Is a Reference Scale?
A reference scale is a codified set of baseline deliverables that represent known quantities of work. Just as military operators might describe a target’s distance as “two football fields away” to provide immediate spatial comprehension without deploying measuring tape, project teams rely on reference stories to ground abstract estimates.
Step-by-Step Framework for Building a High-Accuracy Reference Scale
Step 1: Establish the Baseline Reference Item
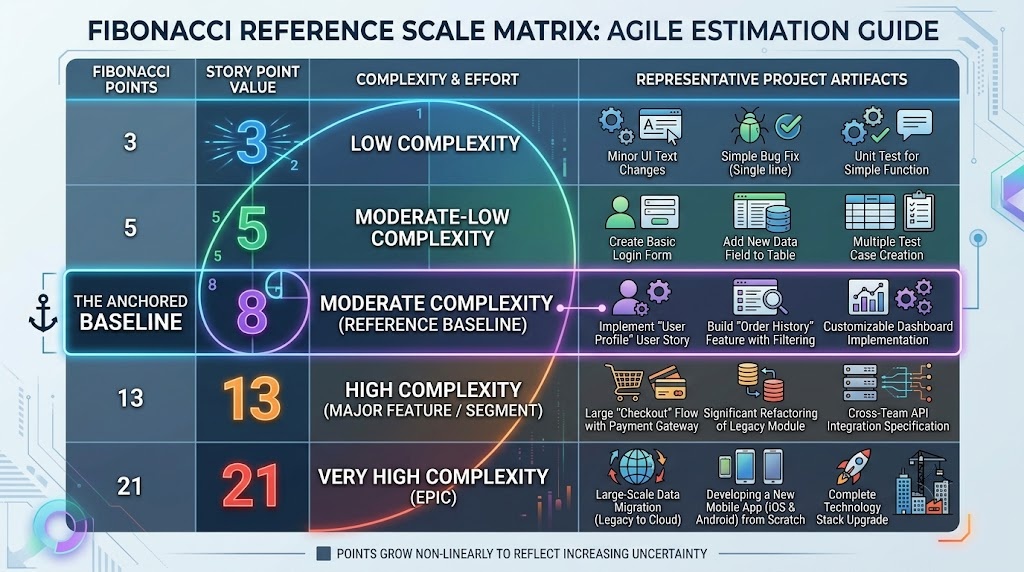
Select a user story or backlog deliverable from your product backlog that represents a well-understood, medium-complexity task (e.g., building a standard project dashboard report).
Ensure the selected task includes all core lifecycle disciplines: architecture, code design, development, unit testing, and quality assurance.
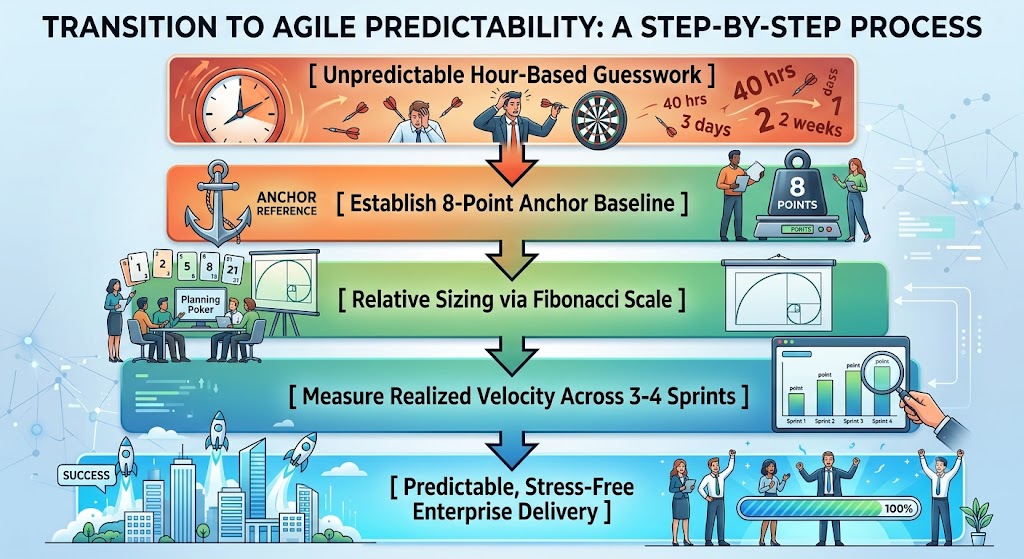
Assign this baseline item an anchor value using the Fibonacci sequence (commonly 8 Story Points). This anchor deliverable remains frozen across future sprints to maintain a consistent estimation metric over time.
Step 2: Implement Fibonacci-Based Story Points
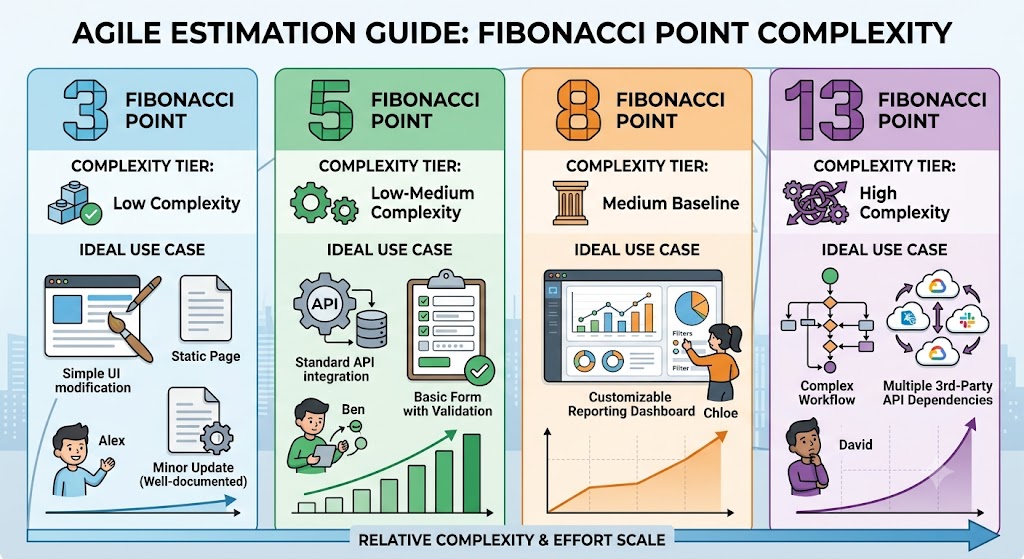
Utilize the modified Fibonacci sequence ($3, 5, 8, 13, 21, 34$) for sizing. The non-linear growth between consecutive numbers reflects the exponential increase in uncertainty and cognitive complexity as tasks scale up.
Step 3: Run the Comparative Sizing Exercise
Introduce a new deliverable (e.g., building an OAuth2 login page supporting multi-provider single sign-on).
Instruct team members to cross-examine the new item strictly against the baseline anchor (the 8-point dashboard report).
Pose the core question: “Is this new feature smaller, equivalent to, or larger in effort and technical risk than our 8-point baseline?”
If the team determines the login page requires OAuth setup, app registration, secret key management, and cloud security configurations, but is overall slightly less complex than a full dashboard, it falls naturally into a lower bucket (such as 5 Story Points).
Operationalizing Consensus
Sizing Techniques and Prioritization
Establishing a scale is only half the battle; project managers must also facilitate consensus across cross-functional teams without allowing senior voices to bias the results.
Technique 1: Planning Poker
Planning Poker eliminates anchor bias and peer pressure during team estimation sessions.
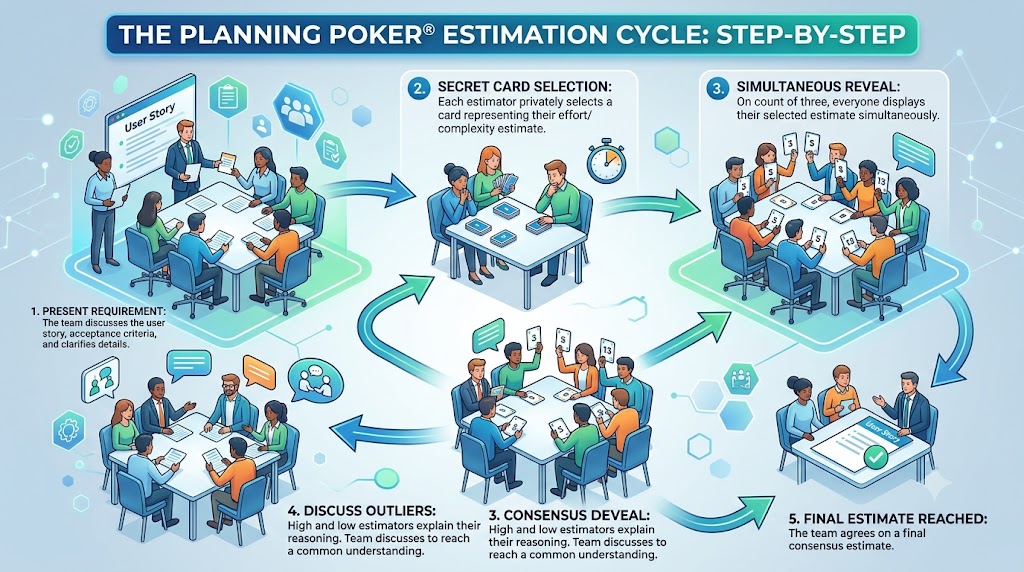
Card Allocation: Every participant receives a deck of cards containing only Fibonacci numbers.
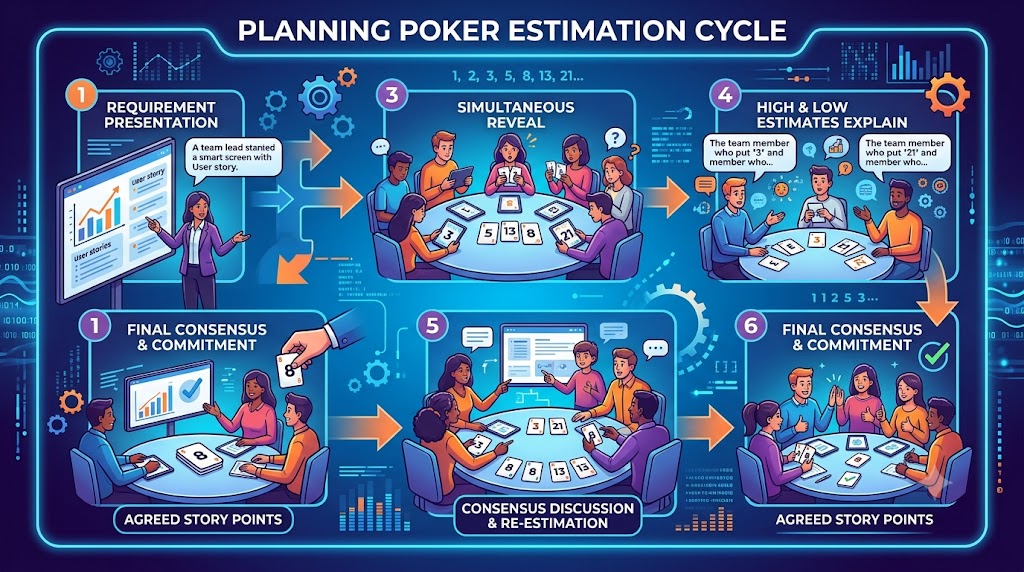
Requirement Review: The Product Owner presents a backlog item and clarifies functional requirements.
Blind Selection: Each team member selects a card representing their relative estimate and keeps it face down.
Simultaneous Reveal: All participants reveal their cards at the exact same moment.
Divergence Discussion: If variance exists (e.g., one engineer estimates 3 while another estimates 21), the highest and lowest estimators explain their rationale. This uncovers hidden risks, architectural dependencies, or over-engineered assumptions before work begins.
Consensus Freeze: Re-vote until the team arrives at a unified estimate.
Technique 2: T-Shirt Sizing
For macro-level epic refinement or long-term portfolio roadmap planning, teams often employ T-Shirt Sizing ($XS, S, M, L, XL$).
While visually intuitive for business stakeholders, these qualitative sizes must ultimately map back to quantitative Fibonacci values in the delivery backend to track engineering velocity and capacity accurately.
Technique 3: Anonymous Dot Voting for Prioritization
When managing competing, non-dependent user stories within a sprint backlog, teams use Dot Voting to democratize prioritization:
Each team member receives a fixed budget of virtual or physical “dots” (e.g., 100 points/dots).
Members distribute their allocation across candidate backlog items based on perceived technical necessity and value delivery.
Aggregating votes in descending order reveals the true cross-functional consensus, eliminating individual executive bias and highlighting high-impact work items.
From Estimation Chaos to Predictable Velocity
Transitioning from time-based guessing to comparative reference scales transforms the entire operational footprint of B2B delivery teams.
Unlocking True Team Velocity
Velocity is defined as the average number of story points a dedicated team completes within a standard iteration cycle (e.g., a two-week sprint).
Velocity cannot be accurately determined in the first iteration. It requires two to four sprint cycles of consistent estimation against a fixed reference point to settle into an accurate metric. Once a team establishes that their stable velocity is 30 Story Points per sprint, project managers gain incredible predictive power:
Scope Realism: If a client requests 120 points of scope, the project manager can confidently commit to a 4-sprint delivery roadmap without forcing engineers into arbitrary overtime.
Early Warning Indicators: Variance in completed story points immediately highlights systemic blockers, environmental downtime, or scope creep rather than team inefficiency.
Sustained Performance: Decoupling pressure-filled clock hours from complexity calculations reduces workplace burnout, increases retention, and stabilizes code quality.
Accelerate Your Executive PM Career with Skillsetify
Mastering relative estimation, reference scale architecture, and predictable team velocity is what separates tactical task coordinators from elite B2B project leaders.
If you are ready to stop guessing, eliminate scope creep, move up the corporate ladder, and learn project management the right way, reach out to Skillsetify. We do not just teach frameworks: we show you your exact career growth trajectory.
Transform your delivery methodology and claim your seat at the executive decision-making table. Visit Skillsetify today to explore our advanced B2B project leadership certifications and masterclass programs.