How Elite Agile Leaders Forecast Milestones Without Guesswork
It is 4:45 PM on a Friday afternoon, two weeks before the promised enterprise release date. The boardroom is thick with tension. The Vice President of Product looks across the table, demanding a binary answer to a complex question: “Are we hitting the Q3 milestone or not?”
The Project Manager opens a brightly colored spreadsheet, points to a list of incomplete tasks, and offers a fragile, defensive estimate based on gut feeling and engineering optimism. Deep down, everyone in the room knows the truth. The deadline will be missed, the client relationships will be strained, and the engineering team will endure another round of midnight burnout trying to bridge the gap.
This is the standard corporate execution crisis, and it stems from a foundational misunderstanding of modern delivery tracking.
For years, a pervasive myth has crippled software development organizations: the illusion that Agile frameworks are inherently incompatible with long-term timeline forecasting. Unskilled practitioners frequently hide behind the manifesto, claiming that because they embrace change, they cannot predict delivery schedules.
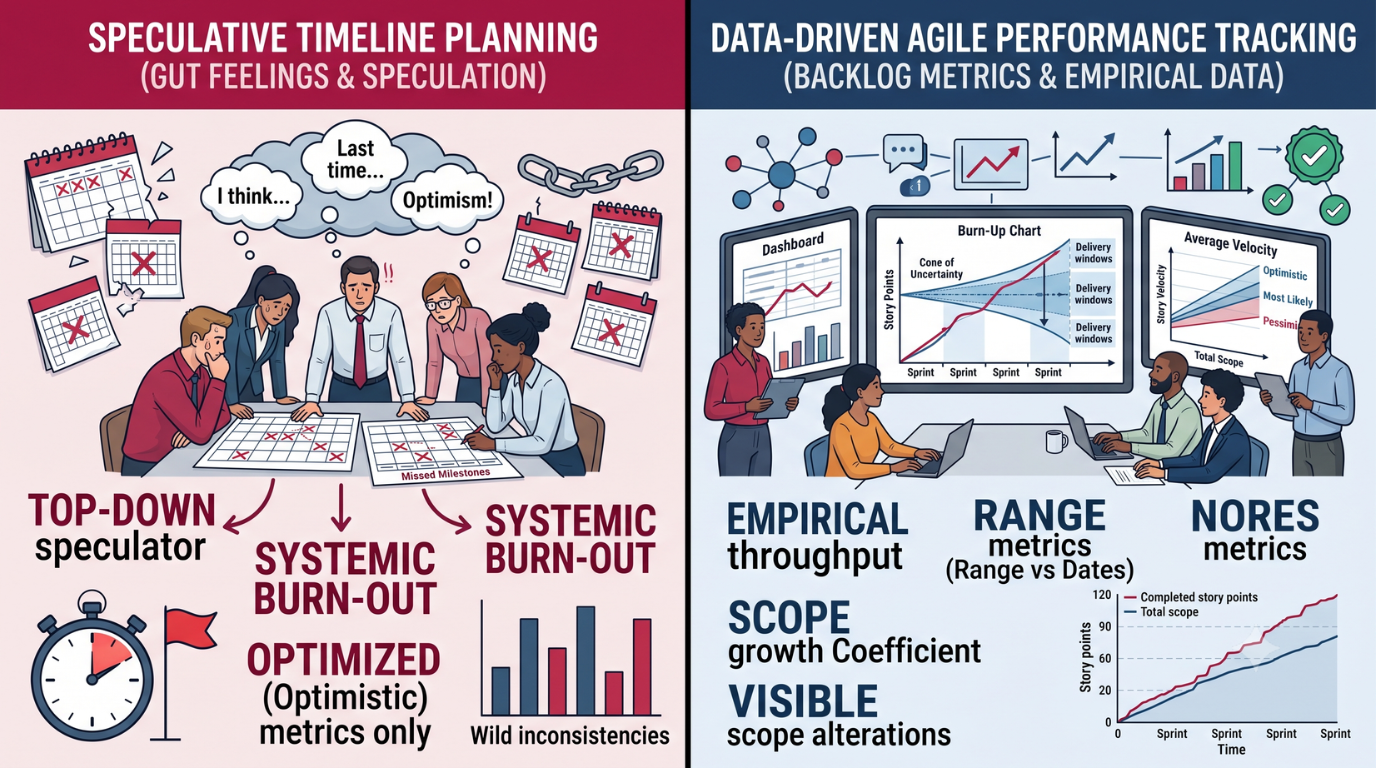
This is incorrect. Elite enterprise project management does not abandon forecasting. It replaces rigid, top-down speculation with algorithmic predictability based on empirical tracking data.
The Mechanics of Agile Milestone Forecasting
To build predictable timeline models, project leaders must shift from tracking time to measuring volume and throughput. Milestone forecasting within an Agile performance tracking architecture is the process of mathematically modeling release duration timelines. This model utilizes two primary empirical variables: overall backlog volume and historical team velocity metrics.
Understanding the Core Variables
Predictable forecasting relies on clear definitions and high data integrity across three specific operational areas:
Overall Backlog Volume: The total sum of estimated effort required to complete a defined scope or milestone. This volume must be measured uniformly, typically using story points or refined sizing buckets, and must account for hidden unestimated items.
Historical Team Velocity: The average number of story points or work units a dedicated development team successfully shifts to a “Done” state within a single time-boxed iteration or sprint.
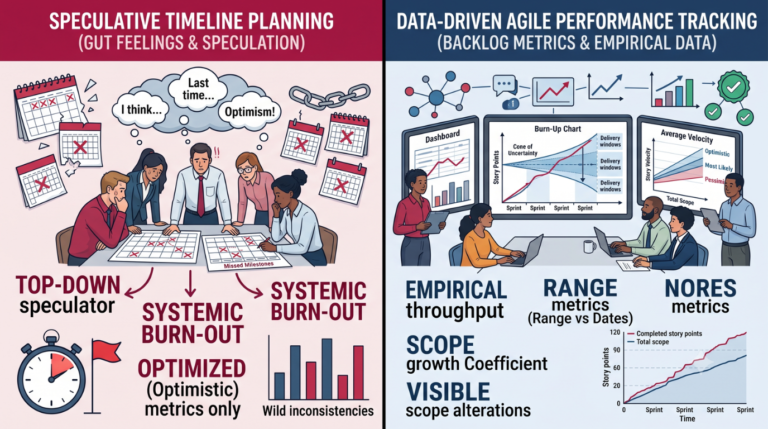
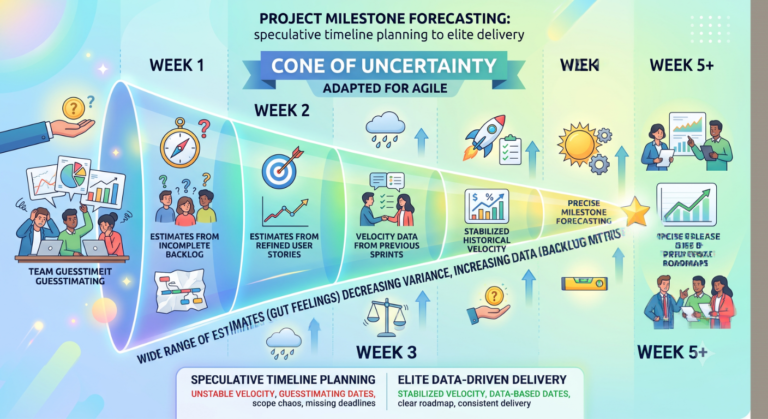
The Cone of Uncertainty: A well-established project management principle showing that variance in project duration decreases over time as requirements become clearer and historical data accumulates. Early forecasts should present as statistical ranges rather than static calendar dates.
Why Enterprise Projects Fail to Forecast Accurately
Most timeline failures do not occur because engineers work slowly. They happen because project managers fail to account for systemic variance.
When a baseline forecast uses an optimized, best-case velocity metric rather than a historical average, the timeline is compromised from day one. Furthermore, if the overall backlog volume is treated as a static number, ignoring historical scope growth patterns, the milestone calculation becomes invalid as soon as new feature requests emerge.
The Step-by-Step Forecasting Implementation Framework
To transition from speculative project planning to elite, data-driven forecasting, implement this empirical framework on your current enterprise backlog.
Step 1: Audit and Baseline Overall Backlog Volume
Before calculating timelines, establish the absolute boundary of your scope. This requires standardizing your backlog sizing units and addressing unestimated work.
Enforce Sizing Uniformity: Ensure the entire backlog allocated to the milestone is estimated using a consistent framework, such as a modified Fibonacci sequence.
Apply the Sizing Ratio for Unestimated Items: If 20% of your current backlog remains unestimated, calculate the average size of your estimated user stories. Multiply that average by the number of unestimated stories to derive a mathematically sound placeholder volume.
Establish the Architectural Baseline: Document the initial total volume as your baseline milestone scope ($V_b$).
Step 2: Calculate True Historical Velocity and Range Metrics
Never base an enterprise forecast on a single optimized sprint performance metric. You must isolate team throughput using multiple statistical vantage points.
Optimistic Velocity (High-Throughput): The average of the top 20% highest-performing sprints within the last six iterations.
Pessimistic Velocity (Low-Throughput): The average of the bottom 20% lowest-performing sprints during the same period, capturing systemic impediments.
Historical Average Velocity ($\bar{v}$): The sum of all story points completed over a minimum of four consecutive sprints, divided by the total number of sprints.
Step 3: Compute the Baseline Release Duration Timeline
With your backlog volume isolated and your velocity metrics stratified, apply the core forecasting equation to establish your milestone delivery window.
To calculate the expected number of iterations required to reach a milestone, utilize the fundamental release duration formula:
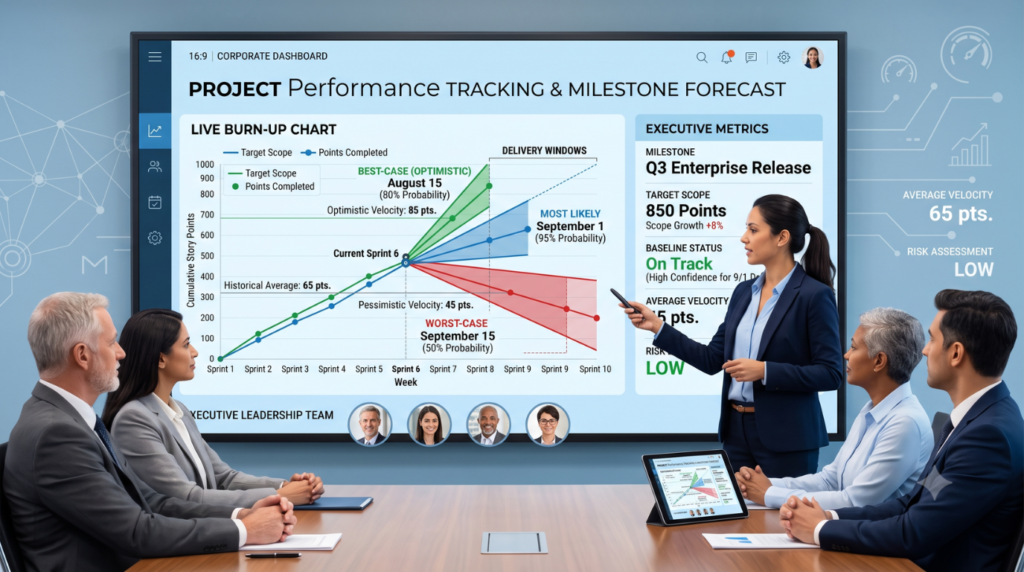
To provide leadership with an accurate risk assessment, run this calculation across your velocity ranges to establish three distinct delivery scenarios:
The Best-Case Scenario: Total Backlog Volume divided by Optimistic Velocity.
The Most Likely Scenario: Total Backlog Volume divided by Historical Average Velocity.
The Worst-Case Scenario: Total Backlog Volume divided by Pessimistic Velocity.
Step 4: Integrate the Scope Growth Coefficient
Backlogs grow during the lifecycle of an enterprise project. Elite project managers use a Scope Growth Coefficient ($C_sg$) to account for this inevitable inflation.
Review historical data from past releases to determine the average rate of scope expansion. If your project backlogs typically grow by 15% between initiation and final deployment due to discovery and refinement, your coefficient is 1.15. Adjust your total volume calculation accordingly:
Use this adjusted volume metric to recalculate your milestone release duration window.
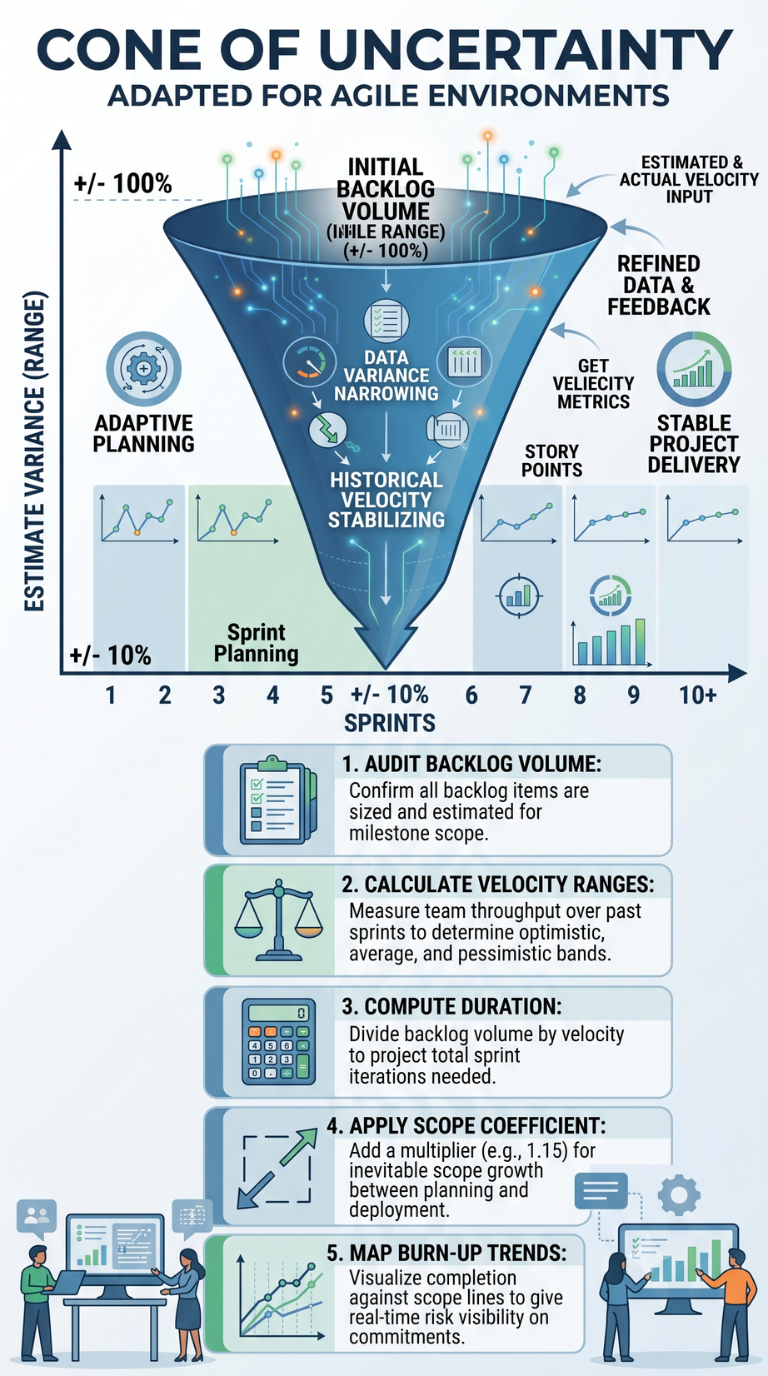
Step 5: Visualize Progress with Empirical Tracking Tools
Once your delivery windows are defined, track executions using charts that explicitly capture both velocity trends and scope alterations.
Agile Burn-Up Charts: Plot total completed story points on the Y-axis against sprints on the X-axis. Include a secondary baseline tracking line that represents the total scope volume. When the scope line rises, it provides immediate visual evidence to leadership that new feature requests are extending the milestone timeline.
Agile Burndown Charts: Maintain a daily macro-level view of remaining milestone points, comparing actual team progress against the linear ideal work trajectory.
From Execution Chaos to Elite Delivery
Transitioning to an empirical tracking infrastructure fundamentally changes the operational reality for project managers, executive stakeholders, and engineering teams.
| Operational Aspect | Traditional Project Guesswork | Data-Driven Milestone Forecasting |
| Executive Reporting | Defensive commitments followed by late-stage delivery failures. | Probabilistic ranges with real-time risk visibility. |
| Scope Management | Invisible scope creep that secretly delays projects. | Visible scope expansion tracked explicitly on burn-up charts. |
| Team Management | Late-stage overtime rushes causing systemic developer burnout. | Sustained development rhythms adjusted to real-world throughput metrics. |
When you master data-driven project milestone forecasting, your value as an organizational leader changes completely. You shift from a administrative status-updater to a strategic partner who protects enterprise commitments with empirical numbers. You stop reacting to execution chaos and start guiding corporate strategy using predictable, data-driven delivery models.
Master the Science of Strategic Project Leadership
Relying on gut feelings and outdated tracking frameworks is an ineffective way to manage enterprise initiatives and steer your career path. If you are ready to stop guessing, move up the corporate ladder, and learn project management the right way, reach out to Skillsetify today.
We do not just teach abstract agile frameworks or ask you to memorize textbook theories. We equip you with the advanced, data-driven methodologies required to solve complex execution challenges in real-world corporate environments. Partner with Skillsetify, master the science of predictable delivery, and clarify your exact career growth trajectory.