Mastering Agile Tracking Chart Mnemonics
The client presentation is scheduled for 9:00 AM on Monday morning. Your dashboard has been flashing a reassuring green for the last three consecutive weeks. Velocity looks stable, milestones are marked as complete, and the burn charts indicate a team on track for on time delivery. You confidently open the executive project update.
By 9:15 AM, the entire presentation has fallen apart.
The software engineers reveal that while the tasks are technically coded, none of them have been integrated into the staging architecture. A critical database mismatch has completely stalled the release pipeline. The green metric was an illusion, a classic corporate placeholder hiding structural engineering fractures. Over the weekend, your team is forced into emergency troubleshooting deployments while product leadership demands to know how a project that looked perfect on paper can collapse so spectacularly in reality.
This is the operational chaos that occurs when organizations confuse data plotting with active performance tracking. Project leaders routinely make the mistake of tracking information they do not understand, leaning on charts as decorative status symbols rather than diagnostic tools.
The most common corporate myth in modern project execution is that progress tracking charts are self-explanatory visual aids. They are not. Without precise cognitive anchors and a clear matrix of role-based accountabilities, team members misinterpret baseline data, swap core functionalities, and fall victim to cognitive exhaustion, turning your agile framework into an empty, expensive ritual.

The Cognitive Architecture of Tracking Mnemonics
To build a highly predictable delivery engine, project managers must eliminate ambiguity from their performance tracking systems. When teams sit down to analyze velocity variances or scope modifications, memory lapses and definition confusion slow down the collective decision-making process. Agile leaders require reliable mental models to ensure tracking integrity across the entire sprint life cycle.
Two critical mnemonics provide the cognitive anchors necessary to keep high-velocity teams aligned, BUCK and BDR.
BUCK: Burn Up equals Completed Work
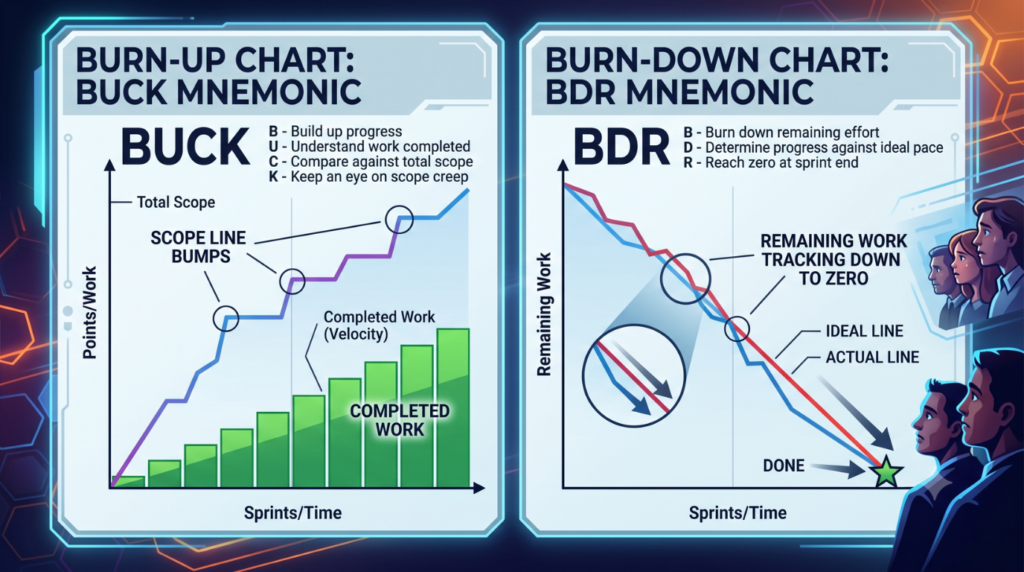
The first common point of confusion in performance tracking is distinguishing between what a burn-up chart measures versus a burn-down chart. To permanently anchor this distinction, elite project leaders use the mnemonic BUCK: Burn Up equals Completed work.
A burn-up chart functions as an accumulation model. The horizontal axis plots time in sprints or working days, while the vertical axis tracks completed story points or feature sets. This chart features two distinct lines: the total scope line at the top and the progress line rising from zero.
Because it explicitly isolates the baseline scope from team delivery, a burn-up chart is the absolute best tool for demonstrating scope changes or addition choices to business executives. If a client adds new feature requirements mid-project, the top line bumps upward, visually defending why the delivery timeline must extend, without making the engineering team look inefficient.
BDR: Burn Down equals Remaining Scope
Conversely, tracking what is left requires a different mental model, anchored by the mnemonic BDR: Burn Down equals Remaining scope.
A burn-down chart is a deflationary tracking tool. It begins at the top left with the total volume of committed story points for that specific cycle and drafts a path downward toward zero. It features an ideal work line, which assumes a linear reduction of effort, contrasted against the actual remaining work line.
While a burn-up chart excels at macro portfolio reporting, a burn-down chart is optimized for micro team diagnostics. It shows day-to-day sprint health at a glance. If the actual work line stays stuck horizontally above the ideal line for five days of a ten-day sprint, it signals an immediate block, alerting the team that their current velocity is insufficient to clear the remaining backlog.
Deconstructing the Role-Based Accountability Matrix
Mnemonics and clean charts are useless if your team maintains a broken accountability architecture. Performance tracking is not a administrative job for a project coordinator. It is a systematic process that requires distinct boundaries between technical execution, process design, and strategic trend analysis.
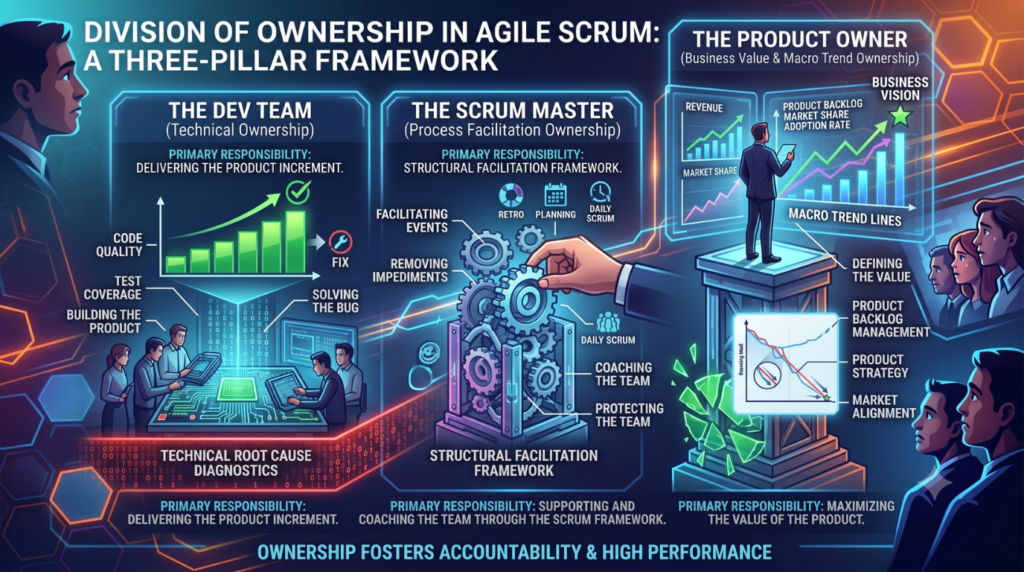
The Development Team: Absolute Owners of the Root Cause
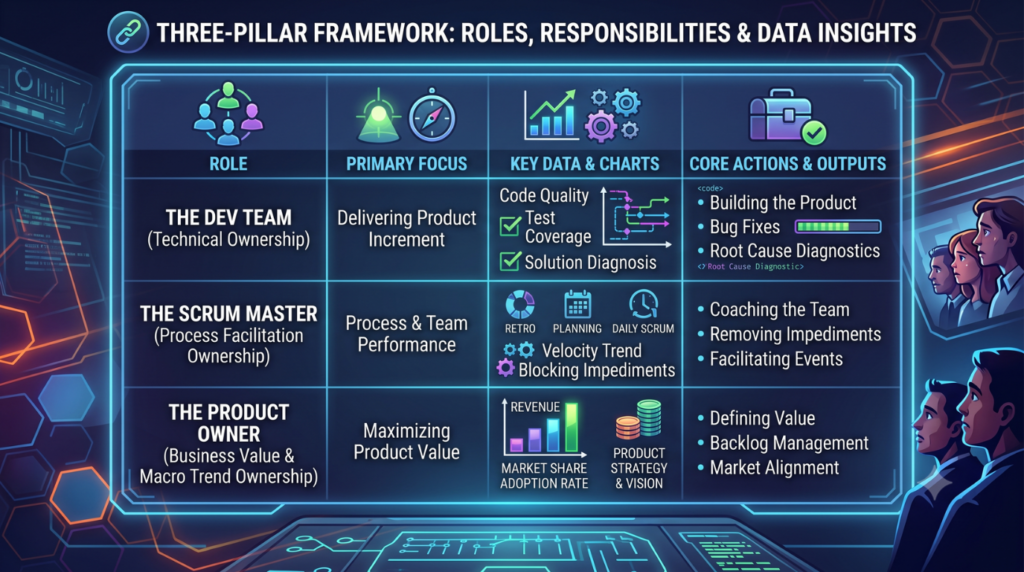
The software engineers, system architects, and designers who execute the work must own the diagnostic phase of the root cause analysis. When the tracking charts show a flatline or a missed sprint commitment, the engineering group cannot remain passive observers. They have the technical context required to look beneath surface-level symptoms and diagnose architectural liabilities, environment mismatches, or testing bottlenecks.
Using structured systems like the 5 Whys, the development team must lead the technical investigation into why their velocity dropped. If the individuals building the code do not take absolute ownership of the diagnostic phase, performance tracking turns into an invasive surveillance mechanism instead of a tool for continuous improvement.
The Scrum Master: Owner of the Facilitation Architecture
The Scrum Master does not fix engineering mistakes, nor do they provide the answers during an analysis. The Scrum Master absolutely owns the facilitation architecture of the performance tracking environment.
The Scrum Master is responsible for keeping the diagnostic sessions psychological safe, objective, and deeply focused on system parameters rather than individual human error. They introduce clean frameworks, shield developers from external corporate finger-pointing, and transform the team’s engineering diagnostics into explicit, trackable process refinements for the upcoming sprint backlog.
The Product Owner: The Guardian of Long-Term Trends
While the engineering team examines the micro variables of a specific sprint failure, the Product Owner is responsible for macro trend verification. The Product Owner reviews historical data across a broader timeline to spot chronic anomalies.
When engineers treat a missed commitment as a one-time issue, the Product Owner checks the historical records to identify recurring patterns. If code instability, vague acceptance criteria, or external dependencies disrupt delivery across multiple cycles, the Product Owner must raise these trends. By asking data-driven questions about these patterns, the Product Owner protects long-term release predictability.
The Strategic Chart Integration and Diagnostics Framework
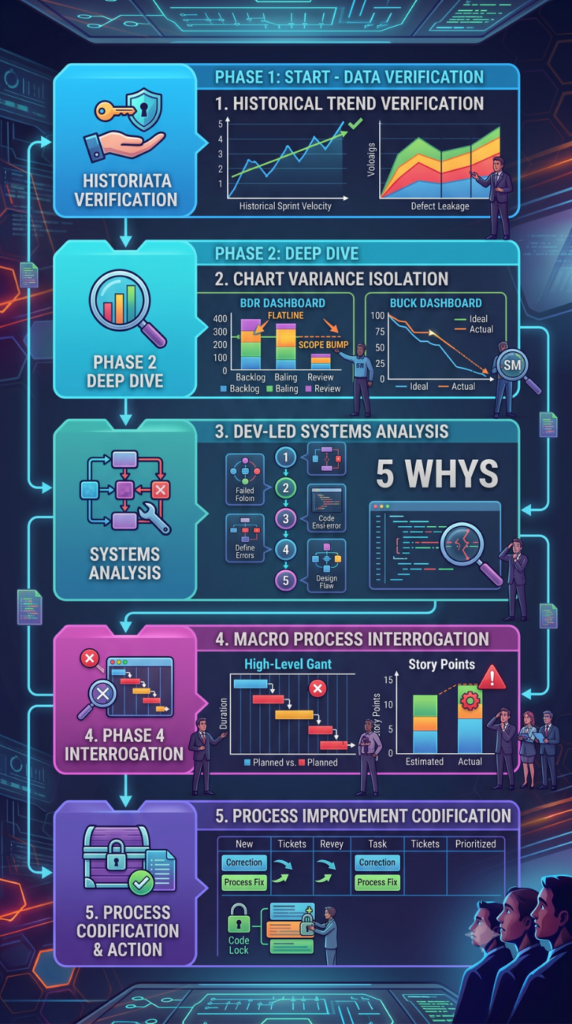
To operationalize BUCK, BDR, and your core accountabilities, project leaders must run a disciplined, step-by-step framework to handle sprint anomalies and protect delivery metrics.
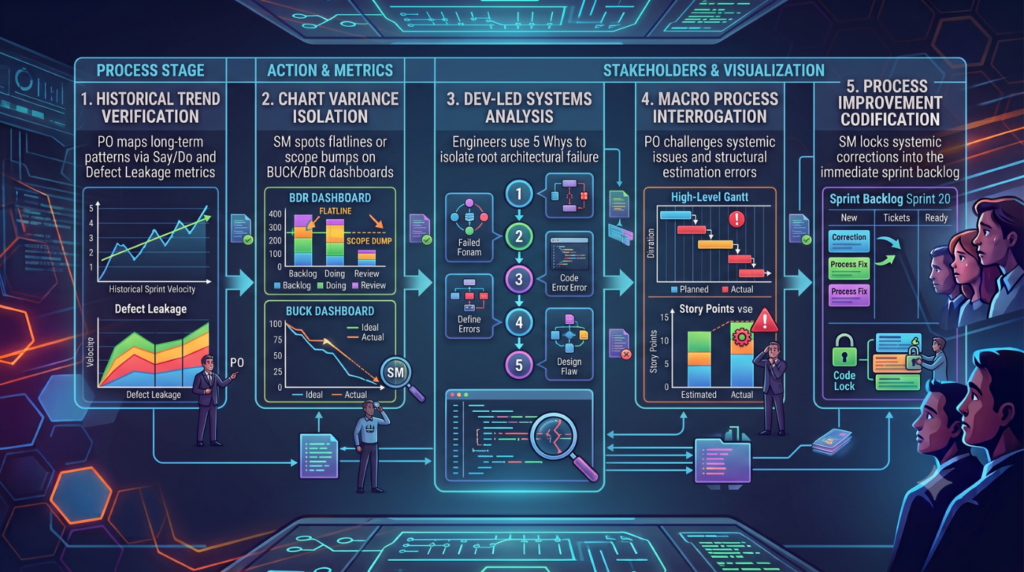
Step 1: Historical Trend Verification
Before a retrospective or planning session begins, the Product Owner reviews the historical trend dashboard. This review scans performance data beyond basic sprint completion metrics to focus on:
The Say/Do Ratio: The variance between committed story points and completed points over a rolling multi-sprint horizon.
The Escape Bug Frequency: The volume of production flaws mapped back to specific architectural layers.
Scope Ingestion Rate: The percentage of requirements altered after sprint initiation due to weak initial refinement.
Step 2: Chart Variance Isolation
During active execution, the Scrum Master monitors the tracking dashboards daily. If a BDR (Burn-Down) chart show a remaining work line plateauing well above the ideal line, or if a BUCK (Burn-Up) chart shows a sudden scope line increase, the Scrum Master isolates the variance. They flag the anomaly immediately for a targeted root cause analysis block within the retrospective session.
Step 3: Dev Led Systems Analysis
The development team takes ownership of the diagnostic canvas. The Scrum Master sets the ground rules, establishing that the goal is to evaluate systemic process vulnerabilities, not individual engineer metrics.
The engineers apply the 5 Whys method to dig past superficial symptoms. For instance, if a velocity drop is blamed on an unexpected environmental failure, they must trace it back:
- Why did the staging environment fail?
- Why did a manual script alter a database profile?
- Why was this profile modification handled manually?
- Why did the deployment pipeline lack an automated parity validation configuration?
The final answer must pinpoint a gap in the system architecture, not human carelessness.
Step 4: Macro Process Interrogation
Once the development team presents their systemic root cause finding, the Product Owner matches their diagnosis against macro corporate trends. The Product Owner asks sharp, data-driven questions to prevent the team from brushing off systemic gaps:
“We identified an environment configuration variance this sprint, but our trend lines show similar environmental blocks happened in prior cycles. Why have our previous automation fixes failed to stabilize this trend?”
“The data indicates that shifting external service dependencies disrupted our commit threshold. This is the third time this quarter that downstream teams stalled our pipeline. How must we update our definition of ready to mitigate this risk?”
Step 5: Process Improvement Codification
With the system root cause verified and macro trends considered, the Scrum Master codifies the solution into specific process tasks. Teams must avoid vague resolutions like “be more careful next sprint.”
Instead, the Scrum Master writes explicit, testable changes, such as: “implement automated database parity checks in the continuous integration pipeline before the midpoint of the next sprint.” These corrections are assigned clear ownership and pulled into the immediate sprint backlog as non-negotiable deliverables.
Shifting from Chaos to Predictable Delivery
When an organization properly implements tracking chart mnemonics and role-based accountabilities, its operational reality changes completely. Teams leave behind erratic firefighting, chronic missed deadlines, and engineering burnout. They enter a sustainable execution rhythm where velocity values normalize and pipeline predictions match reality.
For an ambitious project manager, mastering this systemic diagnostic model changes your entire career path. It moves your professional profile away from a basic tracker who simply repeats data points toward a strategic operations leader who engineers high-performance corporate frameworks.
Senior leadership notices project leaders who can transform volatile delivery pipelines into highly consistent, business-aligned systems. By learning how to analyze tracking charts and direct systemic accountability, you protect your engineering culture and establish yourself as an exceptional candidate for executive advancement.
Transform Your Engineering Leadership with Skillsetify
Fixing agile tracking charts requires a deep structural shift in how your organization manages project metrics. The development team must lead technical problem diagnosis, the Scrum Master must refine the systemic architecture, and the Product Owner must critique performance trends to achieve true delivery predictability. Memorizing basic textbook definitions is no longer enough to build an elite corporate career.
If you are ready to stop guessing, move up the corporate ladder, and learn project management the right way, reach out to Skillsetify. We do not just teach standard agile frameworks: we map out your exact career growth trajectory. Partner with Skillsetify today to gain access to expert operational strategies, step into high-impact executive roles, and transform your delivery tracking into a powerful corporate asset.