How Relative Sizing and Agile Metrics Eliminate Project Failure
On Thursday. Your software engineering team is on their third cold slice of pizza, staring at a broken build pipeline. The commercial product launch was promised to the executive committee six weeks ago based on a pristine, micro-managed Gantt chart. That chart estimated the initiative down to the exact developer hour: 480 hours of frontend development, 320 hours of backend architecture, and 160 hours of quality assurance.
Yet here you are, 1,200 actual hours into execution, with a release candidate that crashes on multi-factor authentication and a lead architect who is quietly updating their resume. The board is demanding answers, the client success team is fielding angry emails, and your sprint burn-down chart looks like a mountain cliff.
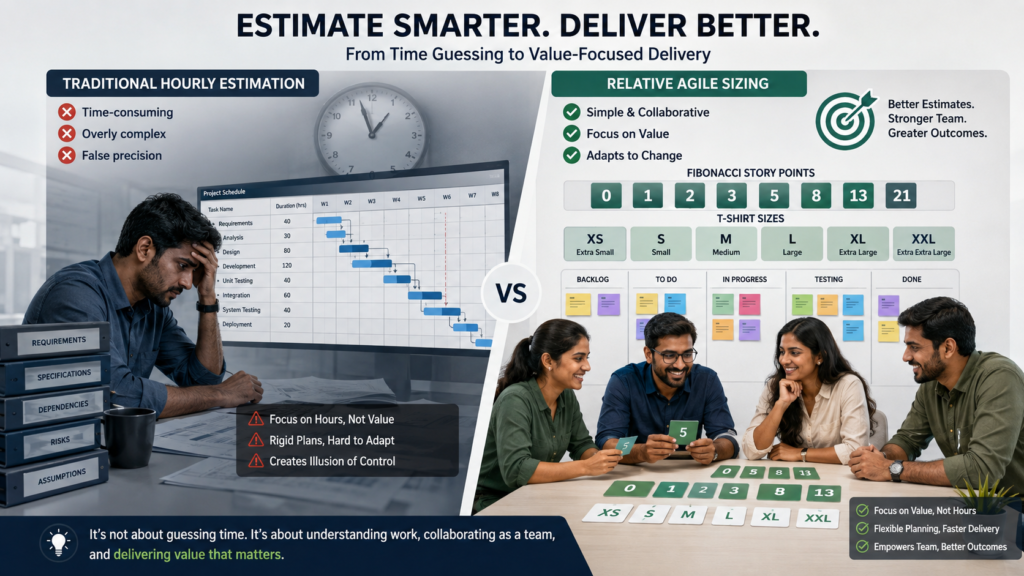
This workplace crisis plays out thousands of times every week across enterprise organizations. The root cause is almost never a lack of technical talent or poor work ethic. The culprit is a flawed management assumption that continues to poison project delivery across the corporate landscape.
The Myth of Absolute Time Estimation
Traditional project management dictates a seductive lie: if you give skilled professionals enough detailed specifications, they can accurately predict work completion down to the exact hour.
This assumption fails because human beings are fundamentally flawed at absolute time estimation. When a project manager asks a senior developer, “How many hours will it take to build this API integration?”, the developer mentally calculates the best case scenario: clean code, clear documentation, no interruption, and zero legacy bugs.
In reality, software development and complex knowledge work are non-linear. They are plagued by unpredictable variables, including cognitive context-switching, undocumented edge cases, third-party dependency delays, and Parkinson’s Law (work expands to fill the time allotted).
When you force professionals to estimate complex work in hours, you do not gain accuracy. You gain false precision, anchored biases, and inflated safety buffers that destroy accountability while giving leadership a false sense of control.
The Deep-Dive & Core Education
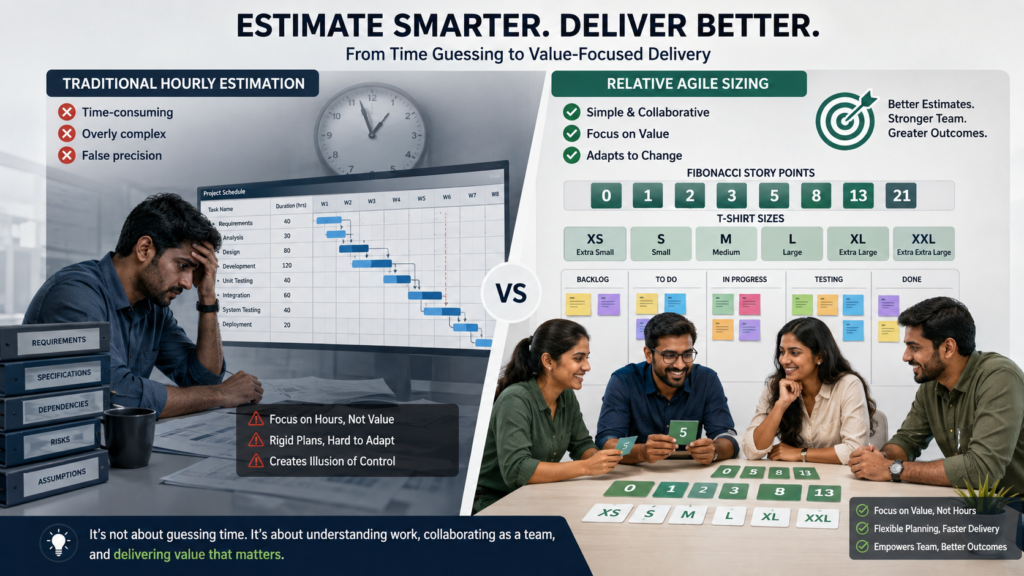
To escape the trap of absolute time estimation, high-performing Agile teams pivot to relative sizing. Relative sizing completely abandons the fool’s errand of calculating clock hours up front. Instead of asking “How long will this take?”, relative sizing asks a far more practical question: “How big is this task compared to a benchmark task we have already finished?”
Why Relative Sizing Works
Relative sizing leverages human intuition. While humans are terrible at estimating absolute dimensions without tools (estimating the exact height of a skyscraper in feet just by looking at it), we are naturally exceptional at relative comparisons (instantly knowing that Building A is twice as tall as Building B).
By decoupling effort from calendar time, relative sizing incorporates three critical dimensions into a single metric:
Complexity: How technically intricate or multi-layered is the implementation?
Effort: How much physical or mental volume of work is required to execute it?
Uncertainty & Risk: How many unknown variables, unverified dependencies, or architectural risks exist?
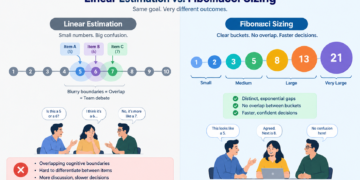
When teams measure work using relative units, such as Story Points, they typically use a modified Fibonacci sequence ($1, 2, 3, 5, 8, 13, 20, 40, 100$). The non-linear jump between numbers forces teams to acknowledge that as work grows in size, uncertainty grows exponentially. Distinguishing between a 1-point task and a 2-point task is straightforward. Trying to debate whether a massive feature is an 8 or a 9 is a waste of energy; the jump from 8 to 13 captures the inherent fog of larger initiatives.
Two Essential Relative Sizing Tools
Agile teams rely on two primary techniques to estimate work across different stages of the delivery lifecycle: T-Shirt Sizing for high-level roadmapping and Planning Poker for granular sprint execution.
1. T-Shirt Sizing for High-Level Backlog Grooming
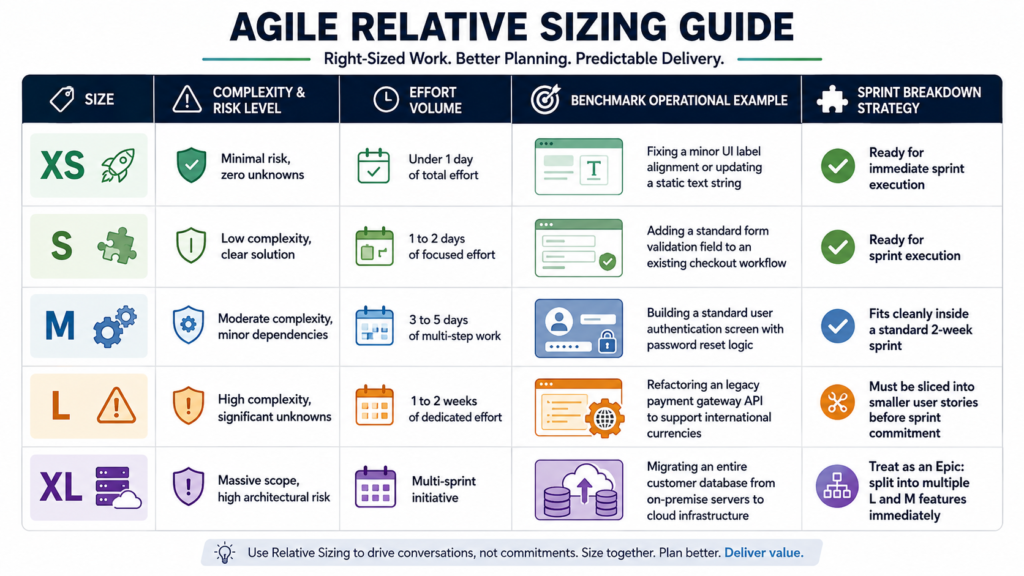
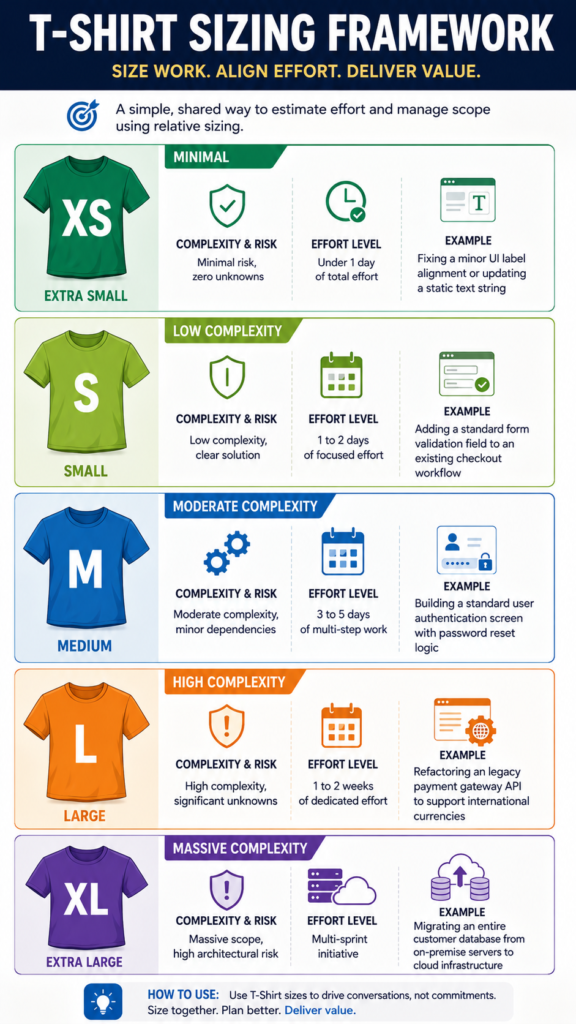
T-Shirt Sizing is a lightweight, intuitive relative estimation technique that assigns standardized sizes (XS, S, M, L, XL) to epics, features, or early-stage backlog items.
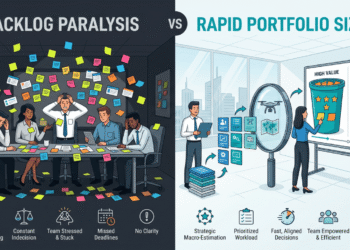
Because it uses non-numerical labels, T-Shirt Sizing prevents business stakeholders from secretly converting estimates back into calendar hours during strategic discussions. It is ideal for portfolio planning, Program Increment (PI) alignment, and initial discovery phases when technical details are still broad.
2. Planning Poker for Sprint Refinement
While T-Shirt Sizing provides macro-level directional clarity, Planning Poker introduces consensus-driven rigor for micro-level sprint backlog items.
Originated by James Grenning and popularized by Mike Cohn, Planning Poker uses specialized decks of cards bearing Fibonacci values. It is designed to expose hidden architectural assumptions and eliminate anchoring bias (where junior team members simply agree with the most vocal senior engineer in the room).
The mechanics of a Planning Poker session follow a strict, highly collaborative workflow:
Step 1: Feature Presentation. The Product Owner presents the user story and reads the explicit acceptance criteria to the delivery team.
Step 2: Technical Clarification. The engineering, QA, and design team members ask clarifying questions regarding dependencies, edge cases, and environment requirements.
Step 3: Private Estimation. Each estimator independently selects a card from their Fibonacci deck that reflects their assessment of complexity, effort, and risk. No one reveals their card yet.
Step 4: Simultaneous Reveal. On the facilitator’s count, every participant reveals their chosen card at the exact same time.
Step 5: Outlier Discussion. If estimates match, the team records the consensus story point value. If estimates vary widely (for example, a range of cards showing 2, 3, 3, 3, and 13), the facilitator invites the lowest estimator and the highest estimator to explain their reasoning.
Step 6: Convergence Re-Vote. The high estimator might reveal a massive hidden security dependency that others missed; the low estimator might reveal an existing reusable component that trivializes the build. After a brief 2-minute discussion, the team re-votes privately. Consensus is usually achieved within two rounds.

The 5-Step Agile Estimation Blueprint for Project Managers
Transitioning an enterprise team from chaotic hour-based guessing to high-velocity relative sizing requires a structured framework. Project managers can deploy this step-by-step blueprint immediately to institute disciplined estimation practices.
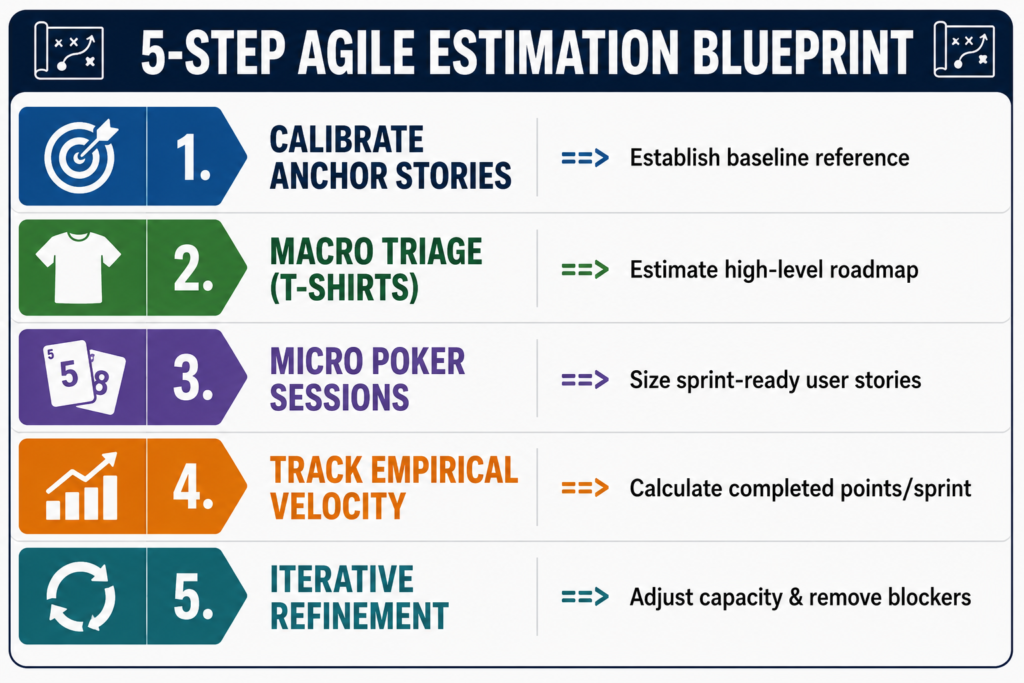
Step 1: Calibrate Reference Stories (The Anchor Baseline)
Before running an estimation session, lead the delivery team through an anchoring exercise. Identify three completed historical tasks from past projects that represent a 1-point, a 3-point, and a 5-point story. Document these reference stories explicitly in your team workspace. Every future estimate will be judged against these real-world anchors by asking: “Is this new story bigger or smaller than our reference 3-point story?”
Step 2: Triage the Macro Backlog with T-Shirt Sizing
Gather product leaders and technical leads for a 45-minute roadmap triage. Review upcoming quarter initiatives and assign T-Shirt sizes (XS through XL). Immediately flag any XL initiatives for architectural spikes or decomposition. This provides leadership with directional scope without burning hundreds of hours in premature technical specification.
Step 3: Conduct Granular Planning Poker Refinement
During weekly sprint refinement, pull T-Shirt sized items that are scheduled for the next two sprints. Break them down into discrete user stories written in standard format (As a [User], I want [Feature], So that [Value]). Run Planning Poker to assign numerical Fibonacci story points. Timebox discussion to 3 minutes per story to keep team energy high and focus on macro risks.
Step 4: Track Empirical Velocity (Not Hours)
At the conclusion of each sprint, calculate the total number of story points completed (only counting stories that meet 100% of the team’s Definition of Done). Average this point total over three to four sprints to establish your team’s historical Velocity. If your team consistently completes 28 story points per sprint, your capacity for the next sprint is empirically 28 points, regardless of holidays, PTO, or executive pressure.
Step 5: Drive Iterative Refinement in Retrospectives
Review your estimation variance during sprint retrospectives. Look at stories where actual complexity dramatically exceeded the initial point value. Was there hidden technical debt? Was the acceptance criteria vague? Use these insights to continuously re-calibrate your baseline reference stories and improve future sizing precision.
The Professional Transformation
Imagine stepping into your next executive steering committee meeting completely in command of your delivery timeline.
Instead of presenting fragile hour estimates that force you to apologize for missed deadlines, you present empirical, data-driven delivery forecasts powered by historic team velocity. When stakeholders request an unexpected high-priority feature mid-quarter, you do not suffer through midnight deployments or engineer burnout. You simply pull up your team’s calibrated velocity metrics and show the trade-off clearly: “We can absorb this new 8-point feature into the upcoming release, but based on our proven 30-point velocity, we must shift these two 4-point items to the next sprint.”
This shift alters your corporate trajectory. You transition from a reactive taskmaster who tracks timesheets into a strategic project leader who manages capacity, mitigates risk, and guarantees delivery predictability.
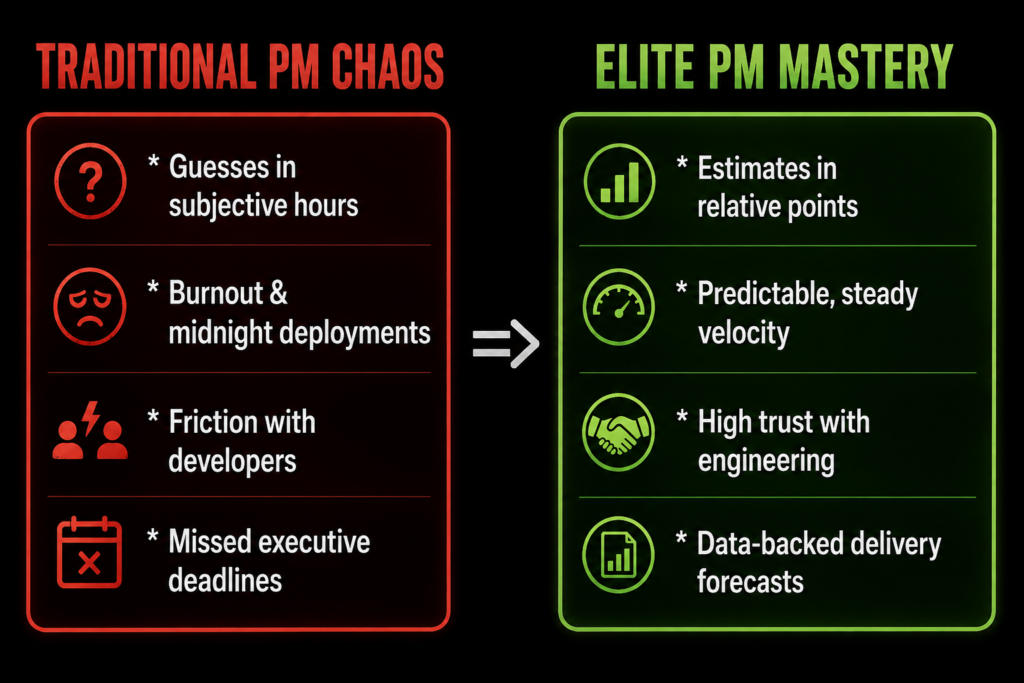
Mastering relative sizing, capacity planning, and Agile metrics elevates your standing across senior leadership. It demonstrates that you understand how modern software and enterprise initiatives are actually delivered: through empirical data, clear team alignment, and psychological safety.
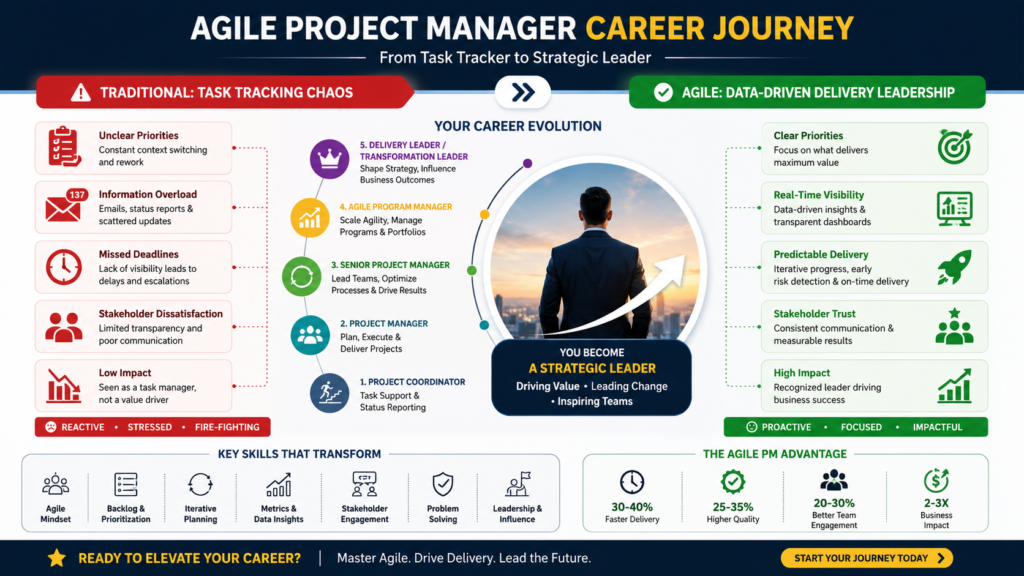
Eliminating estimation guesswork is not about memorizing card values or drawing t-shirts on a whiteboard; it is about building a disciplined system of relative measurement, empirical velocity tracking, and strategic team facilitation. When you stop anchoring project commitments to false time estimates and start managing relative complexity, you unlock sustainable team delivery, eliminate delivery panic, and command respect at every level of the organization.
If you are ready to stop guessing, move up the corporate ladder, and learn project management the right way, reach out to Skillsetify. We do not just teach frameworks: we show you your exact career growth trajectory.