Why Tracking Hours is Ruining Your Project Predictability (And How Story Points Fix It)
Your executive dashboard shows that your engineering team logged 400 hours of work this sprint across 10 team members. On paper, capacity utilization is at 100 percent. The burn-down chart looks neat, and the time-tracking software reports that every developer worked their full week. Yet, when the release demo starts, three major core features fail, key dependencies are blocked, and the deliverable is pushed back two weeks. The VP of Product looks across the room and asks the dreaded question: “If everyone worked 40 hours, why is the project two weeks late?”
This crisis plays out in enterprise boardrooms every single day because project managers fall for the ultimate corporate myth: the belief that time is an accurate proxy for progress. Even worse is the bastardized hybrid where organizations claim to practice Agile while secretly enforcing a toxic conversion rate: “1 Story Point equals 8 Hours.”
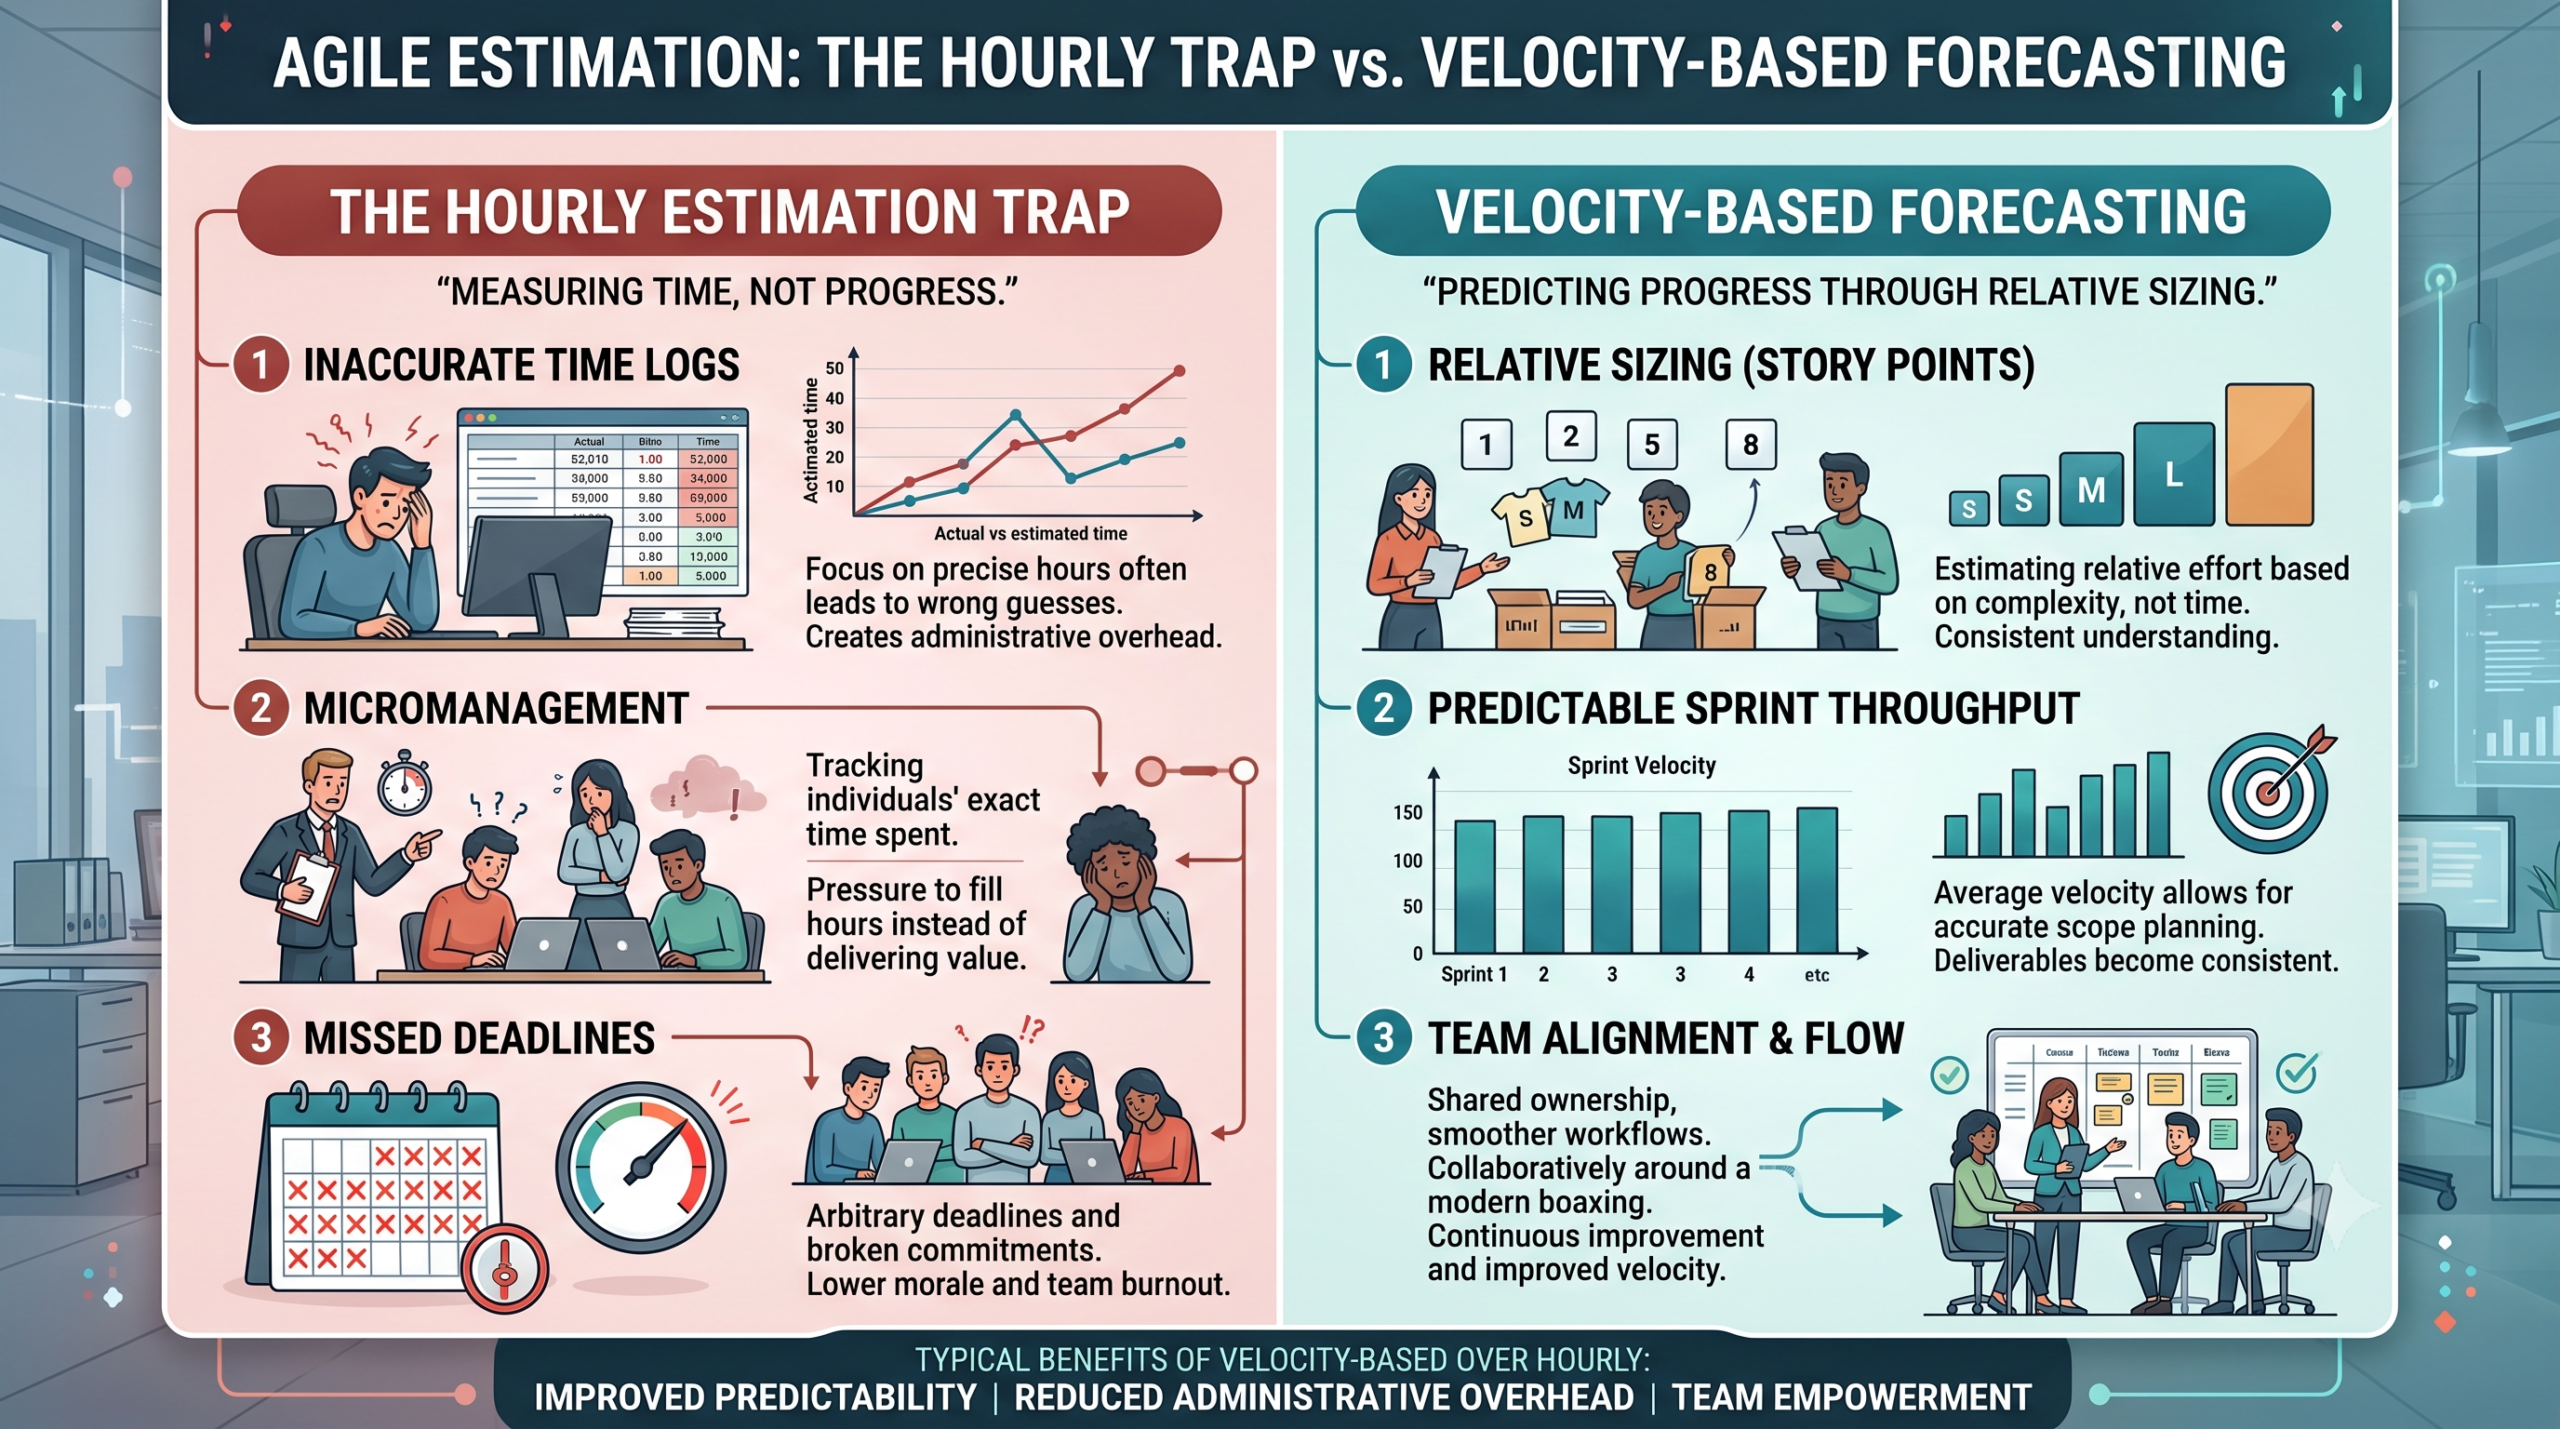
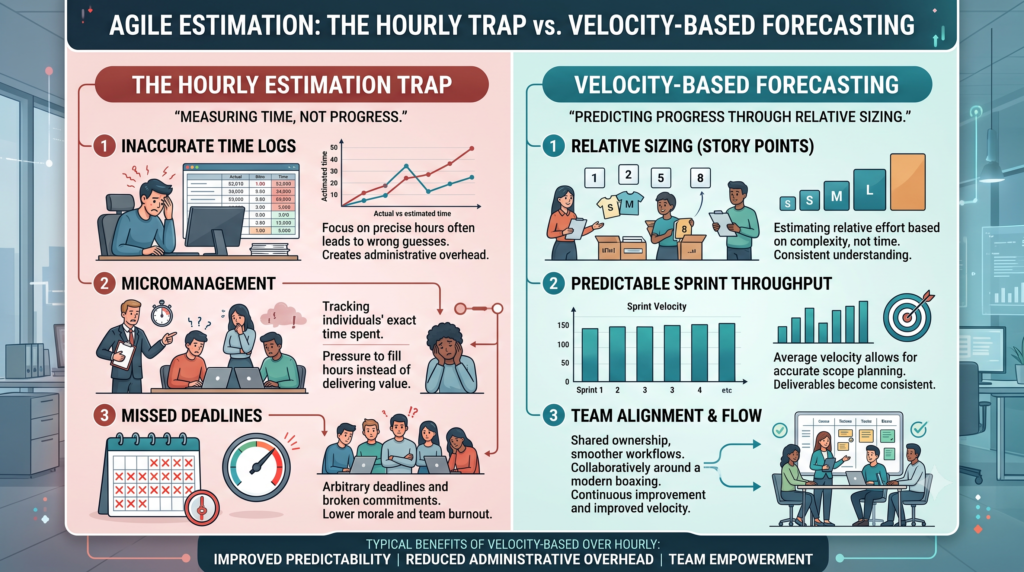
When you force a linear translation between story points and clock hours, you destroy the core utility of Agile estimation. Time tracks input; value and throughput track output. Human beings are notoriously bad at estimating time due to cognitive bias, context switching, and unpredictable technical friction. By forcing knowledge workers to estimate complex deliverables in clock hours, project leaders create a culture of artificial precision, inflated estimates, and systemic delay.
The Flawed Mechanics of Hour-Based Estimation
Why do traditional hourly estimates consistently collapse in modern project environments? The answer lies in the fundamental nature of complex knowledge work. Unlike assembly line manufacturing, where producing a widget takes a fixed number of physical movements, software development, data science, and system architecture are non-linear.
The Hidden Distortions of Hourly Tracking
-
The Senior vs. Junior Velocity Gap: A senior backend architect might refactor an API endpoint in two hours. A junior developer might take fourteen hours to complete the exact same task. If the project manager assigns an “8-hour estimate” to the task, the metric changes depending entirely on who does the work. This makes long-term resource planning impossible before assignment.
-
The Inflation of Safety Buffers: When team members know they will be judged against clock hours, they artificially inflate their estimates. A simple 3-hour task becomes a 12-hour estimate to cushion against interruptions, corporate meetings, and administrative overhead.
-
Parkinson’s Law and Micro-Management: Work expands to fill the time allotted for its completion. If a developer is given 16 hours for a task that takes 6 hours, they will spend 10 hours over-engineering the solution or refining non-essential code. Conversely, rigid time tracking forces project managers into micromanaging timecards rather than facilitating delivery flow.
The Story Point Engine: Relative Effort, Risk, and Complexity
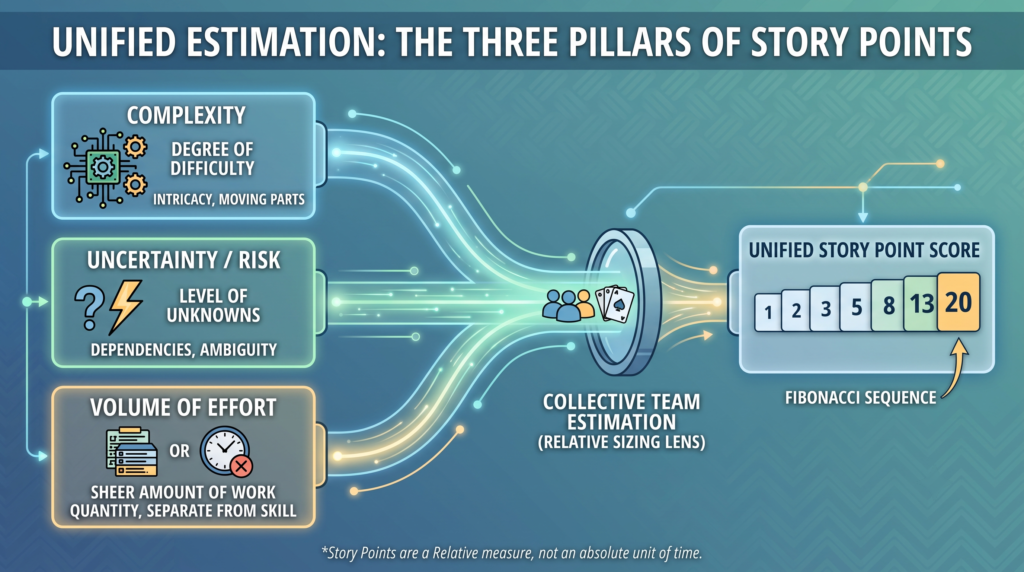
Story points solve the estimation crisis by shifting the unit of measurement from absolute time to relative effort. A story point is an abstract metric that combines three distinct dimensions of work into a single baseline.
Decoding the Three Dimensions of Relative Sizing
Technical Complexity: How intricate is the logic? Does it require multi-system integrations, complex database schema changes, or novel architectural patterns?
Uncertainty and Risk: How many unknowns exist? Are third-party APIs poorly documented? Are business requirements subject to regulatory review?
Volume of Effort: What is the physical volume of work required, assuming zero interruptions and known requirements?
Because story points measure relative effort rather than time, a 5-point user story represents the exact same level of relative complexity whether it is assigned to a principal engineer or an entry-level developer. The senior engineer completes it faster, but the size of the work remains constant.
The Definitive PM Implementation Framework: Operationalizing Velocity
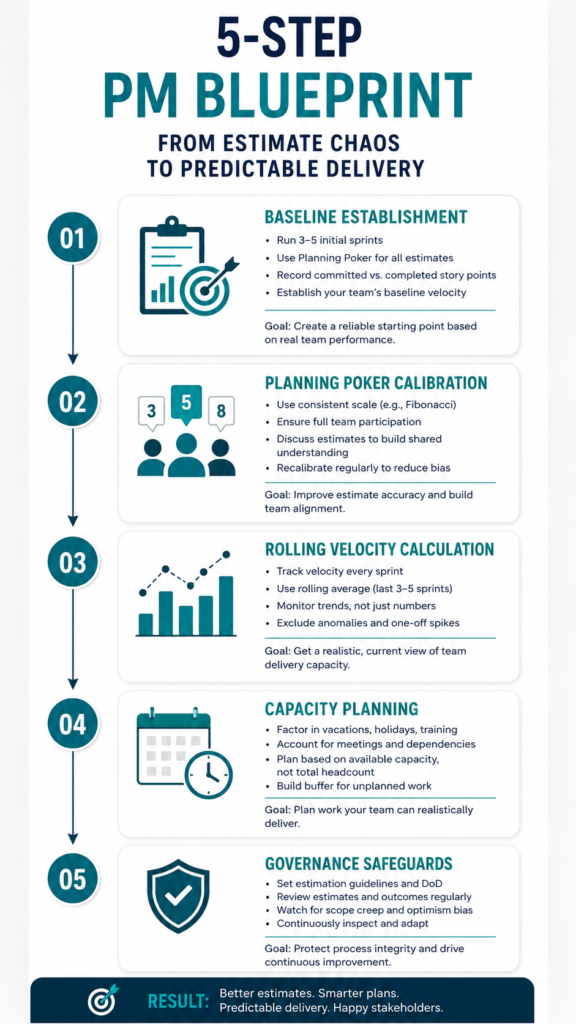
To transition your organization from time-based chaos to predictable velocity-based delivery, follow this five-step implementation blueprint.
Step 1: Establish the Golden Baseline (Reference Story)
Before estimating new backlog items, the team must agree on a “Golden Baseline.” Select a completed, well-understood user story from a past sprint that represents a minimal, low-risk effort. Assign this story a value of 2 or 3 points. Every future task will be sized relative to this anchor.
Example: “Updating an existing form validation rule” equals 2 points. Therefore, a task that requires creating a new multi-step form with external API checks is obviously twice as complex, making it a 5-point story.
Step 2: Adopt Modified Fibonacci Sizing and Planning Poker
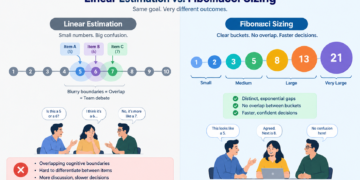
Human brains excel at relative comparison but struggle with granular abstraction. Use the modified Fibonacci sequence (1, 2, 3, 5, 8, 13, 20) during estimation sessions.
Run Planning Poker during backlog refinement: Each team member holds cards representing Fibonacci values. After discussing a user story, all members reveal their cards simultaneously.
If estimates diverge significantly (for instance, a developer votes 2 while a QA engineer votes 8), do not average the scores. Force a conversation. The disparity reveals hidden assumptions, unstated technical risks, or testing bottlenecks that would have doomed an hour-based estimate.
Step 3: Calculate True Operational Velocity
Velocity is the total number of completed story points accepted by the Product Owner at the end of a sprint. Incomplete user stories receive zero points in Agile accounting; partial credit is strictly prohibited to maintain metric integrity.
Track velocity over a rolling window of 3 to 5 sprints.
Formula: Average Velocity = (Sprint 1 Points Completed + Sprint 2 Points Completed + Sprint 3 Points Completed) / 3
If a team completes 32, 28, and 36 points across three consecutive two-week sprints, their operational velocity is 32 points per sprint.
Step 4: Map Capacity Without Converting Points to Hours
Capacity is the team’s available bandwidth for an upcoming sprint, factoring in planned PTO, public holidays, and onboarding friction.
Do not convert 32 story points into hours. Instead, adjust point intake proportionally based on team availability.
If a 5-person team with a velocity of 32 points has one engineer on leave for a 10-day sprint (a 20 percent reduction in headcount), reduce the target sprint commitment by 20 percent to 25.6 (round down to 25 story points).
Step 5: Safeguard Against Point Inflation (Goodhart's Law)
Goodhart’s Law states: “When a measure becomes a target, it ceases to be a good measure.” If executive leadership pressures project managers to “increase team velocity from 30 to 50 points,” teams will simply re-estimate 3-point stories as 5-point stories. Velocity is an internal team diagnostic and release forecasting metric, not a cross-team performance evaluation metric.
| Metric Category | Hour-Based Tracking | Story Point Tracking |
| Unit of Measurement | Absolute Clock Hours (Inputs) | Relative Complexity & Effort (Outputs) |
| Estimation Anchor | Individual Developer Speed | Team Consensus & Reference Baseline |
| Impact of Skill Level | Estimate changes based on assignee | Story size remains constant regardless of assignee |
| Delivery Predictability | High variance (up to 400% error rate) | High stability (up to 95% delivery predictability) |
| Long-Term Forecasting | Unreliable due to optimism bias | High accuracy using rolling velocity trends |
| Cultural Impact | Micromanagement and padded estimates | Psychological safety and collaborative alignment |
From Firefighting Taskmaster to Strategic Delivery Leader
When you eliminate hour-based tracking and master velocity management, your day-to-day reality as a project leader undergoes a massive upgrade.
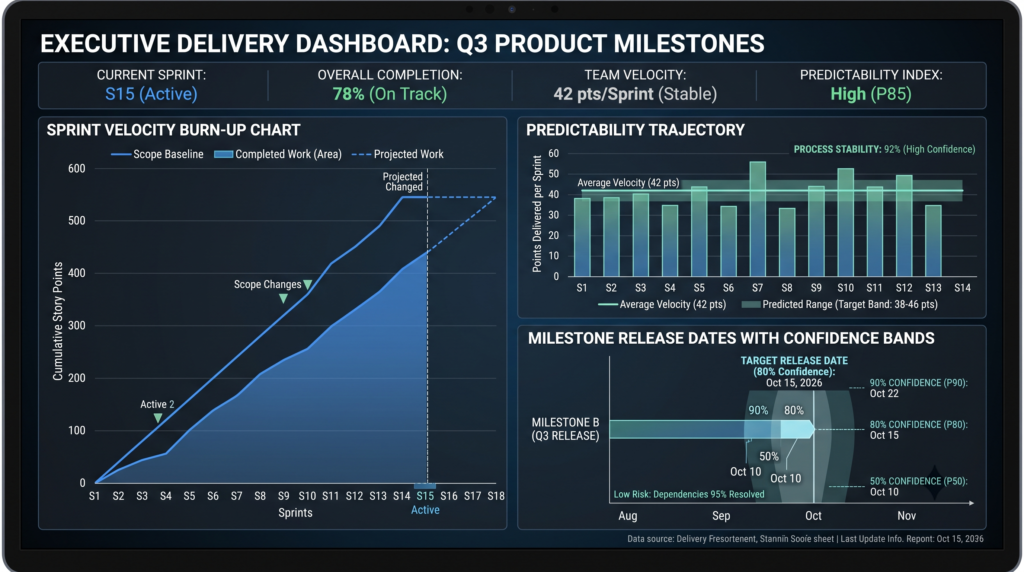
You no longer spend your Mondays auditing timecards or defending why a 10-hour task took 16 hours. Instead, you operate with data-driven delivery forecasting. When stakeholders ask, “When will the enterprise integration module be ready for launch?”, you do not give a wild guess or a risky deadline. You open your velocity burndown chart, point to a backlog of 160 story points, divide it by your stable rolling velocity of 32 points per sprint, and confidently state: “Based on our empirical velocity, this will ship in exactly five two-week sprints, with a 90 percent confidence interval.”
This transition elevates your standing in the organization. You move from being an administrative taskmaster who chases status updates to a strategic delivery leader who protects team capacity, eliminates delivery bottlenecks, and consistently hits business objectives. Senior executives do not care how many hours your team logged in Jira; they care about predictable, high-quality outcomes. Mastering relative estimation is the fastest way to build that credibility and accelerate your career trajectory into executive project leadership.
Master Elite Delivery Frameworks with Skillsetify
Navigating modern project management requires more than just reading agile frameworks; it demands operational mastery of real-world metrics, capacity planning, and stakeholder leadership.
If you are ready to stop guessing, move up the corporate ladder, and learn project management the right way, reach out to Skillsetify. We do not just teach frameworks: we show you your exact career growth trajectory. Through real-world enterprise scenarios, hands-on mentorship, and advanced project leadership training, Skillsetify equips you to drive predictable execution and stand out as an indispensable delivery leader in today’s high-stakes business environment.