How Elite Project Managers Predict Output and Stop Team Burnout
The Friday Afternoon Meltdown
It is end-of-sprint Friday, and the executive board room is filled with tension. The latest release cycle has just closed, and for the third consecutive iteration, the engineering team delivered less than sixty percent of its committed features. The Product Director blames sluggish execution. The Engineering Lead points to unmanaged scope creep, technical debt, and team exhaustion. The Vice President of Delivery demands a simple answer to a painful question: Why can we never predict when work will actually be finished?
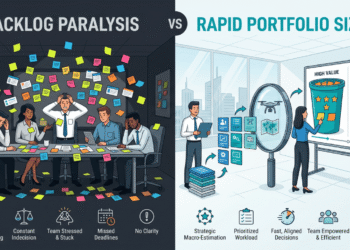
This high-stress corporate crisis plays out every week across hundreds of enterprise organizations. Teams promise high output during planning, hit unexpected friction mid-cycle, work late-night hours to compensate, and ultimately deliver delayed, bug-ridden releases.
The Great Corporate Myth: Velocity is a productivity metric designed to force teams to deliver faster every sprint.
This assumption destroys software delivery teams. In reality, velocity is not a gas pedal to be stomped on. It is a tool for measuring stability, operational throughput, and delivery capacity. When leadership treats velocity as an ever-increasing target, teams respond by inflating estimations, cutting quality corners, and burning out.
To build an elite delivery engine, project managers must shift away from pushing for raw speed and focus on establishing Velocity Boundaries: upper and lower capacity thresholds that define a team’s true delivery rhythm over short cycle lengths.
The Mechanics of Velocity Boundaries and Relative Estimation
Understanding Velocity in Short Cycle Lengths
Team velocity represents the volume of fully completed work delivered by a specific cross-functional group within a fixed iteration cycle, typically two weeks. The objective of velocity tracking is predictability, not speed.
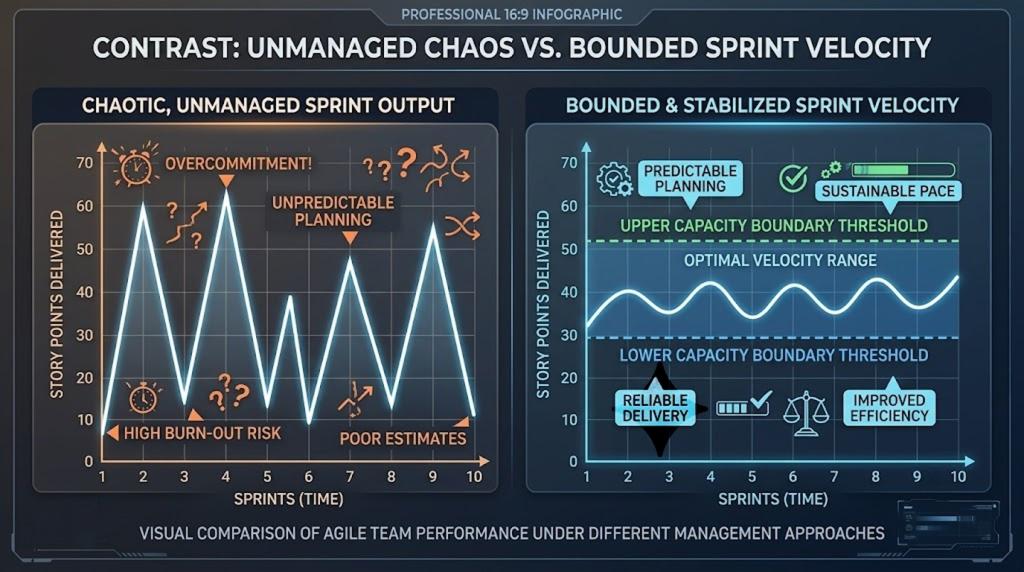
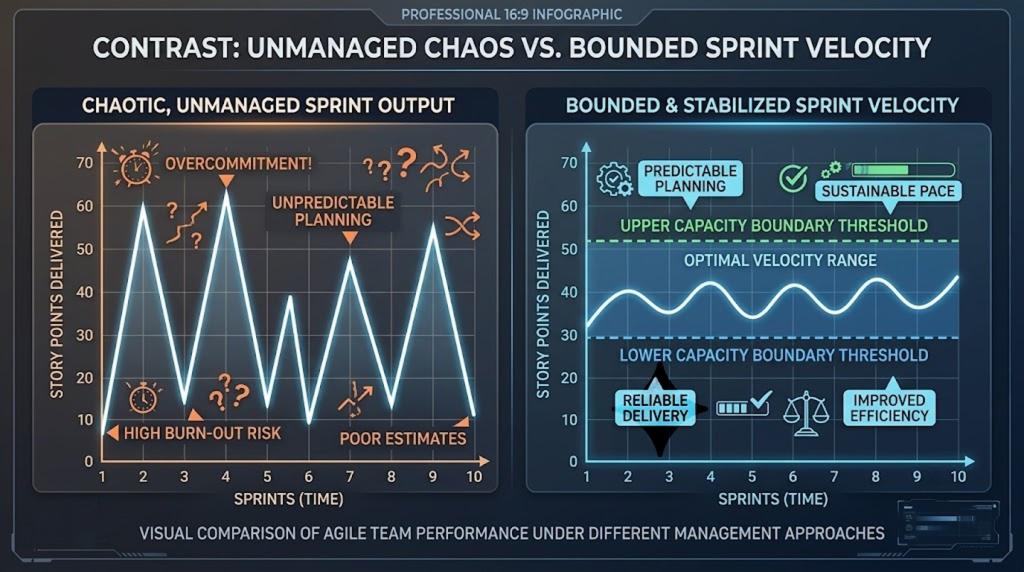
Measuring consistent output delivery requires establishing Velocity Boundaries. A team does not have a single, static velocity number. Instead, a mature team operates within an operational boundary range:
Upper Velocity Boundary (Vₘₐₓ): The maximum story point threshold a team can complete without working overtime, accumulating technical debt, or skipping testing protocols.
Lower Velocity Boundary (Vₘᵢₙ): The minimum baseline output expected under normal working conditions, accounting for typical operational friction and minor unplanned disruptions.
Target Velocity Baseline (Vₘₑₐₙ): The historical mathematical mean of points completed over past stable iterations, serving as the default planning baseline.
When sprint commitments exceed Vₘₐₓ, team burnout and incomplete deliverables become mathematically inevitable. When commitments drop below Vₘᵢₙ, team capacity is underutilized. Operating consistently within these boundaries creates a predictable cadence that enterprise stakeholders can rely upon for long-range roadmap planning.
The Cognitive Science of Relative Estimation
Establishing reliable velocity boundaries is impossible if task estimations are tied to raw clock hours. Human beings are notoriously inaccurate at predicting absolute hours for complex intellectual tasks due to planning fallacy and hidden technical nuances.
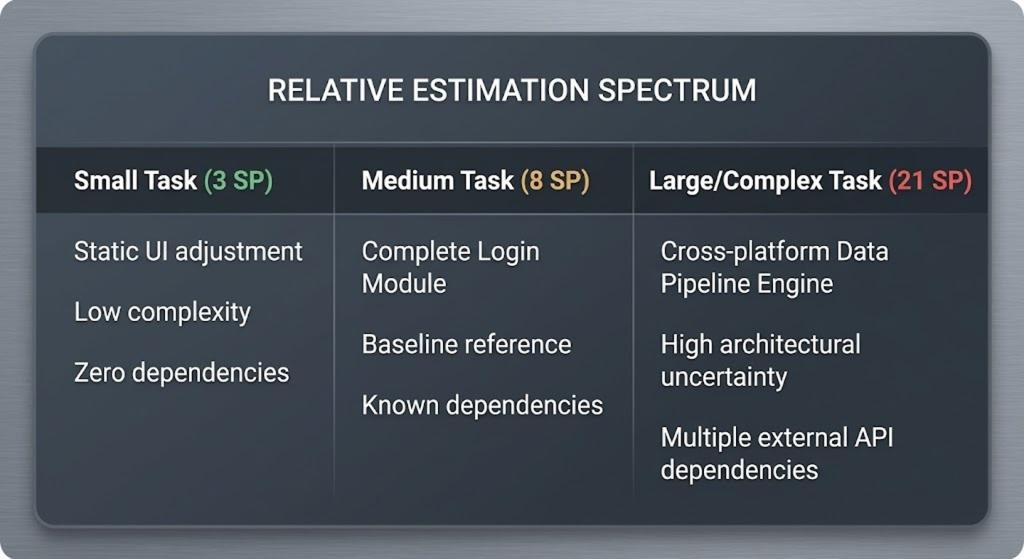
Agile frameworks resolve this cognitive limitation through Relative Estimation. Instead of asking how many hours a task will take, project leaders train teams to compare new work against a known reference point.
The Fibonacci Sequence for Story Points
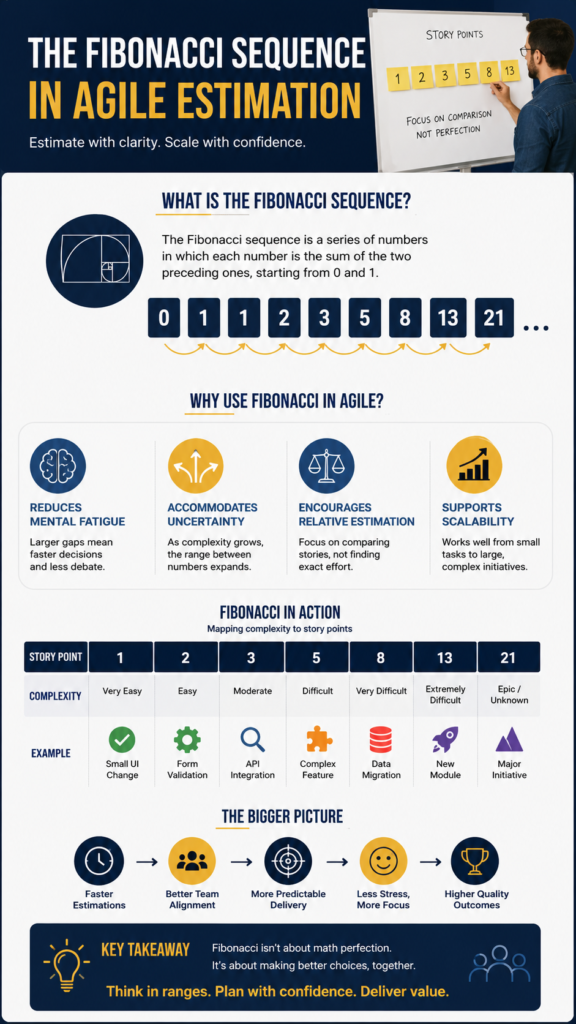
To enforce relative thinking and reduce cognitive load, teams use modified Fibonacci scales: 1, 2, 3, 5, 8, 13, 21, 34, 55, and so on.
As tasks grow larger, estimation uncertainty increases exponentially. The gap between consecutive numbers widens, forcing the team to acknowledge complexity rather than debating trivial differences. A team does not waste time arguing whether a feature is a 12 or a 14: the expanding sequence forces a clear choice between an 8, a 13, or a 21. If a story reaches a 21 or 34, it signals that the work is too large and must be broken down into smaller, manageable units before entering a sprint.
Consensus Building and Prioritization Protocols
Arriving at consistent story point estimates across a cross-functional team requires structured alignment protocols to prevent loud voices or senior titles from dominating the process.
1. Planning Poker
To eliminate anchoring bias, team members review a user story and secretly select an estimation card reflecting their individual assessment. On the team leader’s signal, all members reveal their cards simultaneously.
If estimates align, the estimate is locked. If significant variance occurs (for example, one developer selects a 3 while another selects a 21), the team does not average the numbers. Instead, the outliers explain their reasoning:
The high estimator reveals hidden architectural complexities or security integration risks that others missed.
The low estimator highlights existing reusable code components or automation scripts that simplify the work.
Following a brief discussion, a secret re-vote takes place until consensus emerges around a unified story point value.
2. The Fist-of-Five Technique for Requirement Clarity
Before locking an estimation, the project manager verifies requirement clarity by asking for a Fist-of-Five vote:
5 Fingers: Absolute clarity. Ready to execute.
3 to 4 Fingers: Sufficient clarity with minor questions.
1 to 2 Fingers: High ambiguity or unresolved blocking dependencies.
If any team member holds up fewer than three fingers, sprint estimation stops immediately. The Product Owner must clarify acceptance criteria, architectural prerequisites, or testing requirements before estimating the story.
3. Strategic Dot Voting for Priority Alignment
When selecting user stories for sprint inclusion from a wide backlog, teams use Dot Voting to establish priorities without organizational hierarchy influence. Each team member receives a fixed allocation of digital or physical dots (for instance, 100 virtual voting tokens) to distribute across candidate user stories.
Members place more tokens on high-value, high-risk, or foundational technical prerequisite tasks. Sorting stories by total votes reveals true collective priority while eliminating executive bias.
The Implementation Blueprint for Project Managers
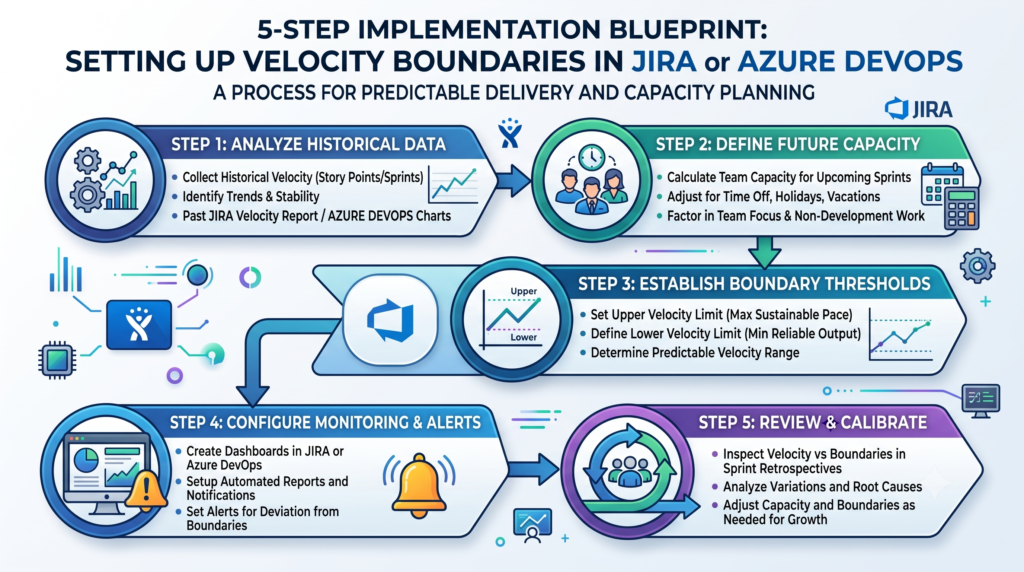
To establish operational Velocity Boundaries, implement this five-step execution framework across upcoming sprint cycles.
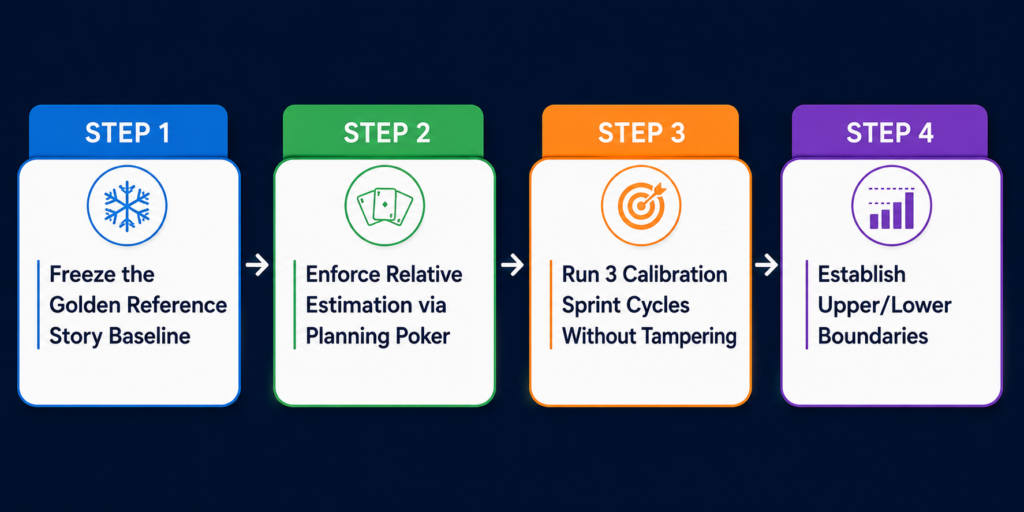
Step 1: Freeze the Golden Reference Story
In your initial planning session, select a medium-complexity, well-understood user story from the backlog (such as building a standard data entry form or creating an authenticated API endpoint). Assign this story a fixed value of 8 story points.
This story becomes the permanent anchor for the life of the initiative. Every future user story is measured against this anchor: Is this new feature bigger or smaller than our reference 8-point story?
Step 2: Enforce Blind Relative Sizing
Run sprint estimation using blind voting mechanisms like Planning Poker. Ensure developers, database engineers, UI designers, and QA testers contribute to the estimation process. Require full cross-functional alignment before locking point values.
Step 3: Run Calibration Iterations (Sprints 1 through 3)
Do not attempt to define velocity during the first sprint. Allow the team to complete three consecutive two-week cycles without management altering team composition, shift parameters, or tools. Track strictly Completed Story Points that meet the formal Definition of Done at the end of each cycle. Partially completed stories receive zero points in velocity calculations.
Step 4: Calculate the Operational Boundary Corridor
Sprint 1 Completed: 26 Story Points
Sprint 2 Completed: 34 Story Points
Sprint 3 Completed: 30 Story Points
Calculate your baseline metrics:
Vₘₑₐₙ = (26 + 34 + 30) ÷ 3 = 30 Story Points
Vₘᵢₙ = 26 Story Points (Lower Velocity Boundary)
Vₘₐₓ = 34 Story Points (Upper Velocity Boundary)
Your operational boundary corridor is now established at 26 to 34 Story Points.
Step 5: Enforce Capacity Guardrails During Sprint Planning
During all subsequent sprint planning meetings, enforce the upper boundary guardrail strictly:
- Never commit to backlog items totaling more than Vₘₐₓ (34 SP).
2. Default your target plan to Vₘₑₐₙ (30 SP).
3. If operational capacity is reduced due to holidays, paid time off, or training, scale the sprint commitment downward proportionally below Vₘᵢₙ.
Transforming Team Chaos into Career Acceleration
Life After Velocity Boundaries
Implementing Velocity Boundaries creates an immediate shift in team dynamic and organizational performance:
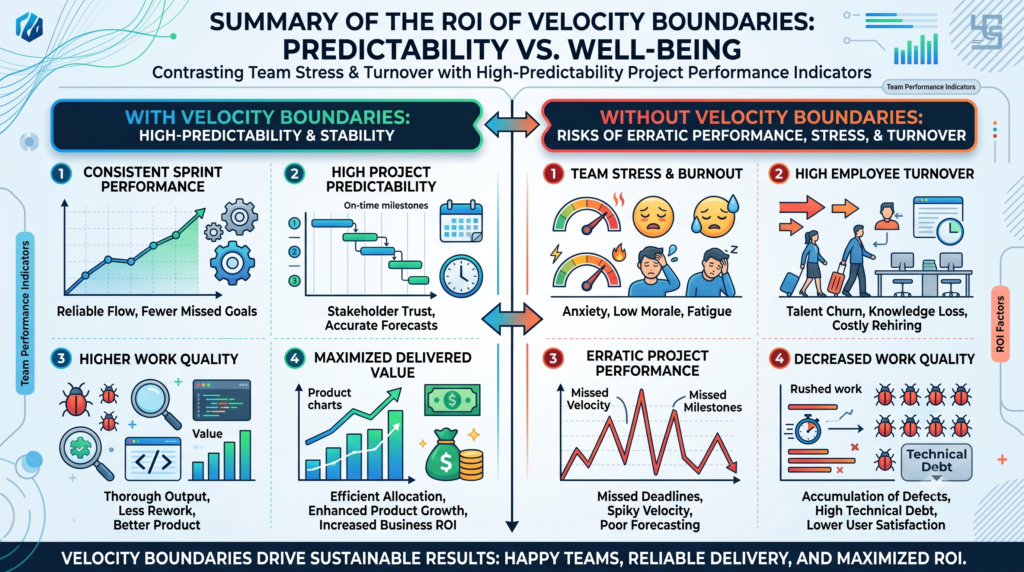
Before Velocity Boundaries: Constant sprint scope adjustments, chaotic release delays, finger-pointing between product and engineering, frequent late-night emergency bug fixes, and systemic team burnout.
After Velocity Boundaries: Predictable delivery output, sustainable work schedules, high release quality, calm sprint planning sessions, and high trust from enterprise stakeholders.
When you master the art of tracking velocity through structured boundaries, you transform from an administrative task-tracker into a strategic delivery leader. Executive leadership values project managers who deliver predictable outcomes far more than those who make aggressive promises they cannot keep.
Predictable delivery builds professional influence. It allows you to protect your team from scope creep, defend resource boundaries with hard delivery data, and consistently deliver enterprise value on time. Mastering these methodologies marks the difference between surviving in entry-level coordination roles and advancing into senior program leadership.
Master Strategic Project Leadership with Skillsetify
Tracking team velocity through precise boundaries is just one piece of elite project delivery. Navigating complex corporate environments, managing dependencies, and steering high-performing teams requires deep, applied methodology that extends far beyond basic certifications.
If you are ready to stop guessing, move up the corporate ladder, and learn project management the right way, reach out to Skillsetify. We do not just teach frameworks: we show you your exact career growth trajectory.
Executive Action Summary Checklist
[ ] Acknowledge Capacity Limits: Stop using velocity as a tool to demand faster output; start using it as a guardrail for delivery capacity.
[ ] Anchor Relative Sizing: Freeze a baseline 8-point reference user story across all sprint estimations to keep team evaluation stable.
[ ] Utilize Modified Fibonacci Scales: Implement 1, 2, 3, 5, 8, 13, and 21 story point values to account for natural estimation uncertainty.
[ ] Enforce Blind Consensus Protocols: Use Planning Poker, Fist-of-Five, and Dot Voting to eliminate title bias and ensure requirement clarity.
[ ] Establish Your Operational Corridor: Calculate Vₘᵢₙ, Vₘₐₓ, and Vₘₑₐₙ across three stable iterations, and never allow sprint planning commitments to exceed your upper boundary threshold.