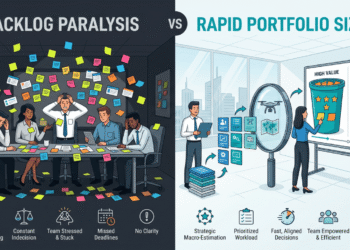
Why Random Baseline Selection Sabotages Agile Velocity
The Cold-Start Trap in Sprint Planning
On a Friday, during Sprint 3, the delivery room is tense. A high-stakes enterprise platform migration is falling behind schedule, and sprint velocity has collapsed by nearly 60 percent. The VP of Engineering demands an immediate explanation. The development velocity charts look like a rollercoaster, sprint planning sessions drag on for four hours, and developers are locked in exhausting arguments over whether a simple API endpoint requires three story points or eight.
When the delivery leadership conducted a root-cause analysis, the culprit was not lack of engineering talent or ambiguous business requirements. It was a subtle, overlooked mistake made during the initial setup in Sprint 0. The team had faced the classic cold-start problem of relative estimation: how do you assign a relative point value to item number one when no baseline scale exists?
To save time, the project manager randomly picked an arbitrary user story from the product backlog, declared it an “8” on a modified Fibonacci scale, and instructed the engineering team to use that single item to ground all future numerical sizing metrics.
The Corporate Myth: “Any backlog item will do as a baseline reference, as long as you assign it a number.”
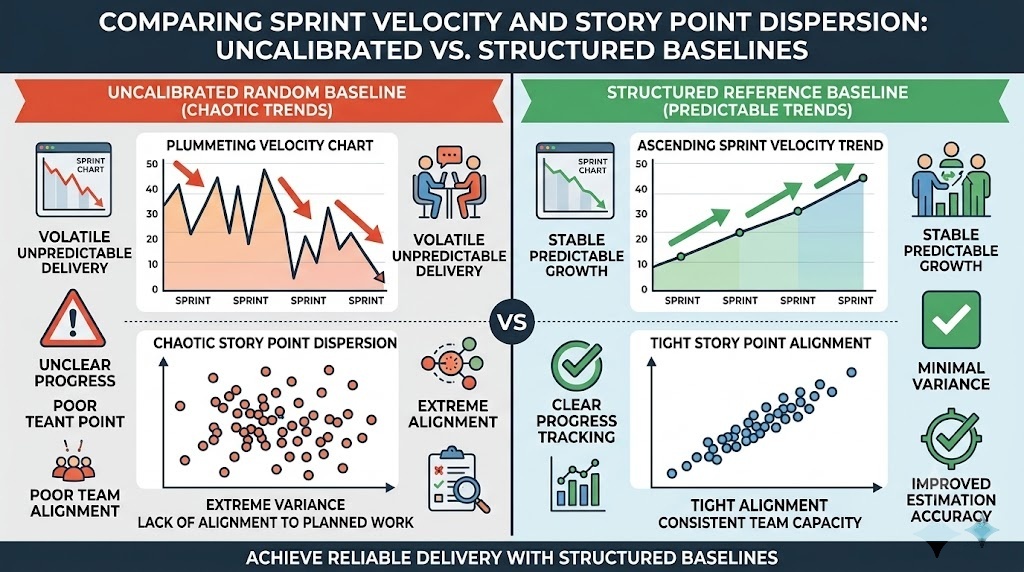
Many engineering leads and project managers believe that relative sizing is purely abstract, so selecting a random, arbitrary backlog item as an anchor point is sufficient. This assumption is dangerously wrong. Random baseline selection introduces catastrophic anchor bias, distorts team estimation metrics, degrades forecasting predictability, and creates perpetual friction during sprint planning.
Deconstructing Story Point Mechanics and Reference Baselines
What is Sizing Calibration?
Story points represent abstract, unitless metrics used by Agile teams to evaluate the total effort required to fully implement a product backlog item. Unlike traditional time-based estimates measured in hours or days, a calibrated story point value synthesizes three distinct variables:
Amount of Work: The sheer volume of technical tasks required to fulfill the acceptance criteria.
Complexity: The technical difficulty, architectural intricacies, or algorithmic friction involved.
Risk and Uncertainty: Unknown variables, legacy code dependencies, or ambiguous third-party integrations that could introduce delays.
Relative estimation works because human cognition excels at comparing two objects against one another far better than calculating absolute metrics in isolation. However, relative sizing requires an accurate, stable reference baseline to serve as the ground truth for all comparative measurements.
Why Random Baseline Selection Fails
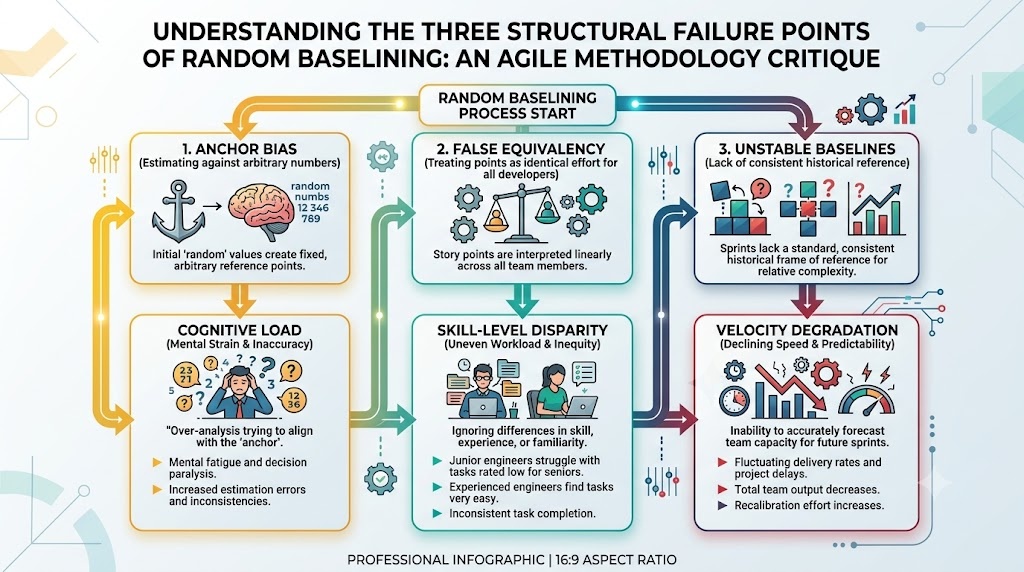
Randomly grabbing an item from the product backlog to serve as your foundational baseline introduces three fatal structural failure points:
1. Severe Anchor Bias and Cognitive Load
If the randomly chosen story contains hidden architectural complexities, ambiguous requirements, or undisclosed external dependencies, it corrupts the baseline. If an unexpectedly difficult task is anchored as a “5”, team members will struggle to evaluate simpler or more complex tasks relative to it, drastically increasing cognitive load and forcing lengthy debates during planning sessions.
2. The False Equivalency Paradox
When teams estimate in hours, senior engineers and junior developers produce vastly different numbers for the exact same task due to skill differentials. Relative story point sizing solves this by focusing purely on total effort. However, when a baseline item is picked at random without full cross-functional scrutiny, different team members project their individual skill levels onto that anchor, creating mismatched reference scales across the engineering group.
3. Velocity Volatility and Degradation
Sprint velocity is defined as the total number of fully completed story points meeting the Definition of Done in a given iteration. When the reference baseline fluctuates due to an uncalibrated starting anchor, the point values assigned across subsequent sprints become unstable. This makes long-term release forecasting and capacity planning virtually impossible.
Step-by-Step Implementation Framework for Calibrated Baselining
To eliminate baseline instability, Project Managers and Scrum Masters must move away from random item selection and execute a structured, calibrated baselining methodology.
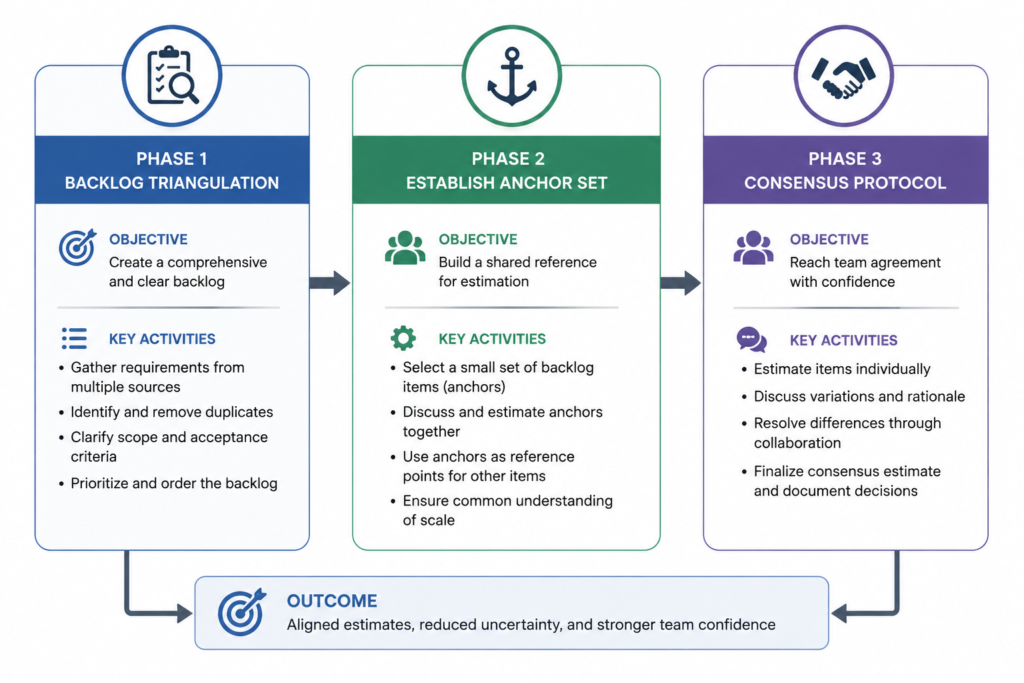
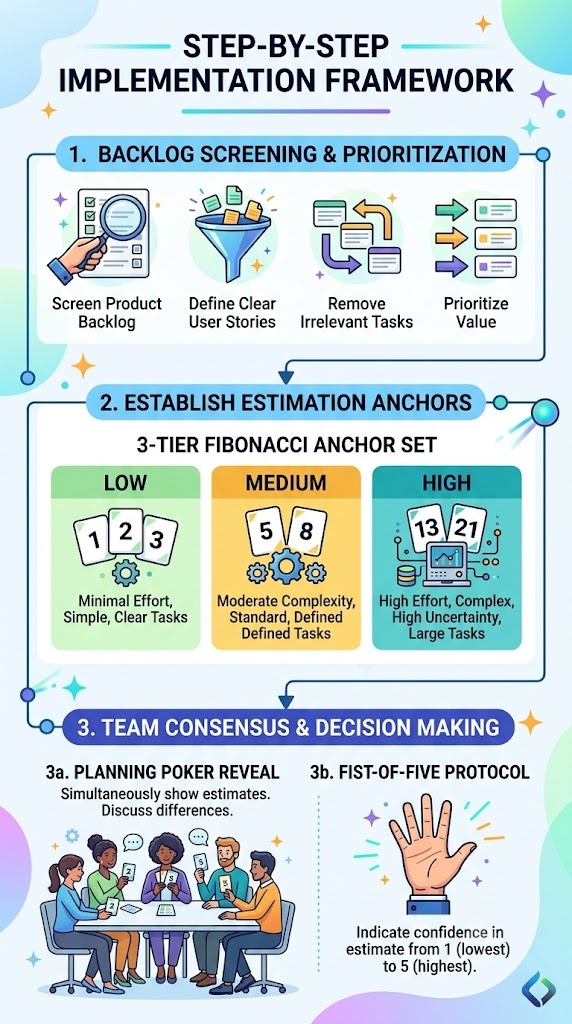
Phase 1: Backlog Screening and Triangulation
Rather than selecting a single random story, curate three candidate stories across varying levels of effort from a refined backlog.
Audit Acceptance Criteria: Ensure candidate stories have crisp, fully elaborated acceptance criteria and a clear Definition of Done.
Exclude Volatile Items: Filter out items with unresolved technical spikes, high external dependencies, or unverified architecture.
Select Well-Understood Tasks: Choose features that the entire cross-functional team (frontend, backend, QA, database) has previously built or deeply understands.
Phase 2: Establishing the Fibonacci Reference Anchor Set
Instead of relying on a single numerical anchor, establish a multi-point reference scale using the modified Fibonacci sequence (1, 2, 3, 5, 8, 13, 21).
The Low Anchor (2 or 3 Points): A simple, well-defined, routine task (for example, creating a standard database schema update or adding a basic form validation).
The Medium Anchor (5 or 8 Points): A feature of moderate volume and complexity involving multiple layers (for example, building an authenticated API endpoint integrated with a user interface screen).
The High Anchor (13 Points): A complex, multi-component story that approaches the maximum size suitable for a single sprint, requiring architectural care and end-to-end integration testing.
Publish these three stories publicly on your team workspace. They serve as the permanent reference baseline anchors for the life of the project.
Phase 3: The Consensus & Alignment Protocol
When estimating new backlog items against your reference anchors, enforce a standardized alignment protocol during refinement:
Simultaneous Secret Reveal (Planning Poker): Team members select cards representing Fibonacci values privately and reveal them at once to prevent seniority-based anchoring bias.
Targeted Divergence Discussion: When estimates diverge significantly (for example, a senior developer votes a 3 while a testing lead votes a 13), do not split the difference. Ask the highest and lowest voters to explain their reasoning. This uncovers hidden testing requirements or simpler technical workarounds.
Fist-of-Five Confidence Check: Before locking in a score, execute a quick Fist-of-Five vote to verify that all team members feel confident in the consensus relative to the reference anchors.
Mitigating Risk, Edge Cases, and Long-Term Velocity Decay
Real-World Case Comparison: Arbitrary vs. Calibrated Baselining
To understand the operational impact of sizing calibrations, consider how two different engineering groups handle the exact same product backlog:
| Operational Metric | Team Alpha (Random Baseline) | Team Beta (Calibrated Reference Set) |
| Baseline Setup | Selected a random story and labeled it an “8”. | Curated a 3-point reference anchor set (2, 5, 13). |
| Sprint Planning Duration | 3.5 hours per bi-weekly sprint due to sizing debates. | 45 minutes per bi-weekly sprint. |
| Velocity Variation | +/- 45% variance across 6 sprints. | Less than 10% variance across 6 sprints. |
| Estimation Accuracy | High point inflation; frequent rollover of incomplete stories. | Predictable throughput; consistent delivery against committed scope. |
Team Alpha’s random baseline caused developers to treat story points as fluctuating targets. Meanwhile, Team Beta’s calibrated reference set decoupled estimation from individual time metrics, providing a stable foundation for release forecasting.
Advanced Sizing Frameworks for Large-Scale Backlogs
When managing massive enterprise backlogs containing hundreds of user stories, evaluating every item directly against story point anchors can become time-consuming. In these scenarios, project leaders can pair calibrated baselines with complementary relative sizing techniques:
T-Shirt Sizing Mapping
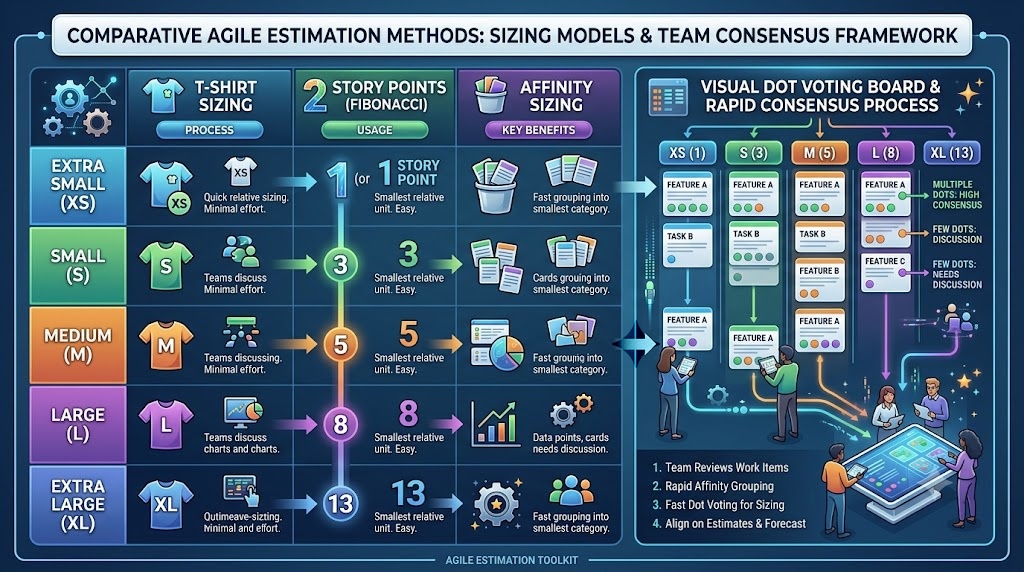
For high-level roadmap planning or initial Epic estimation, use T-Shirt sizes (XS, S, M, L, XL). Map these qualitative tiers directly to underlying Fibonacci point values in the background:
XS (1-2 Points): Minor cosmetic adjustments or basic bug fixes.
S (3 Points): Straightforward, well-understood tasks with zero external dependencies.
M (5 Points): Standard feature additions requiring backend and testing updates.
L (8 Points): Complex features touching multiple systems.
XL (13+ Points): Epics that must be broken down into smaller user stories prior to sprint planning.
Affinity Sizing & Dot Voting
For rapid backlog refinement across 50+ items, conduct an Affinity Sizing session. Display your permanent reference anchors across a physical or digital board. The team silently places backlog items into columns corresponding to the closest reference anchor.
If disagreements arise regarding item placement, use Dot Voting for rapid prioritization. Distribute a fixed budget of virtual dots to each team member, allowing them to allocate dots to highlight stories with high complexity or uncertainty. Items with high dot totals are flagged for deeper technical refinement before sizing is finalized.
Executive Action Steps for Delivery Leaders
Calibrating sizing baselines is not an academic agile exercise; it is an executive operational imperative for predictable product delivery. Project managers, engineering managers, and Scrum Masters can immediately stabilize their team metrics by taking the following concrete steps:
1. Audit Your Current Sizing Anchors Immediately
Review your team’s current backlog estimation practices during the next retrospective. Ask the development team to point to the specific reference story used for sizing. If team members cite different items, or if your starting baseline was selected randomly without cross-functional agreement, schedule a dedicated 30-minute calibration session.
2. Lock In a Permanent, Multi-Point Reference Baseline
Curate three fully completed, well-understood user stories representing low (2-3 pts), medium (5 pts), and high (8-13 pts) complexity. Publish these reference anchors on your project board, making them visually accessible during every sprint refinement and planning session.
3. Decouple Story Points from Absolute Time Metrics
Enforce a strict policy that story points measure relative effort, complexity, and risk, not individual developer hours. Reject leadership demands to convert points directly into hour equivalents (e.g., “1 point = 8 hours”). Protecting relative abstraction ensures consistent velocity metrics regardless of senior or junior resource allocations.
4. Continuous Calibration via Retrospectives
Treat your reference baseline set as a living standard, but modify it with care. In each retrospective, spend five minutes reviewing estimation accuracy. If completed stories consistently required significantly more or less effort than estimated, adjust your calibration anchors to align with reality.
By replacing random baseline selection with a calibrated, multi-point reference framework, software engineering organizations eliminate planning friction, reduce developer fatigue, and establish a predictable, high-velocity delivery engine.