The Science of Relative Logic and Why Absolute Estimates Are Killing Your Deliveries
The lead software architect is staring blankly at a dashboard, sweating through their shirt collar. Standing over their desk is the Vice President of Product, demanding to know why a critical authentication feature estimated at precisely 14.5 hours is still unfinished on day four of the sprint.
The developer attempts to explain that an unannounced rate limit on a third-party API required rewriting the asynchronous request logic. The VP snaps back with the age-old executive grievance: “If it was going to take 30 hours, why did you estimate 14.5 hours in the first place?”
This scenario plays out in corporate boardrooms and engineering floors every single day. Traditional project management has spent decades trapped in a cycle of false precision. Business leaders crave single-number hourly estimates because absolute units provide a comforting illusion of predictability. However, when applied to complex, non-linear knowledge work, absolute duration guessing turns project roadmaps into works of fiction before the ink even dries.
The Common Corporate Myth: “Estimating tasks in absolute hours delivers operational control, executive predictability, and team accountability.”
The Reality: Forcing knowledge workers to guess exact completion hours triggers cognitive bias, breeds cynicism, and ignites project failures. Absolute estimation ignores the inherent volatility of complex technical work.
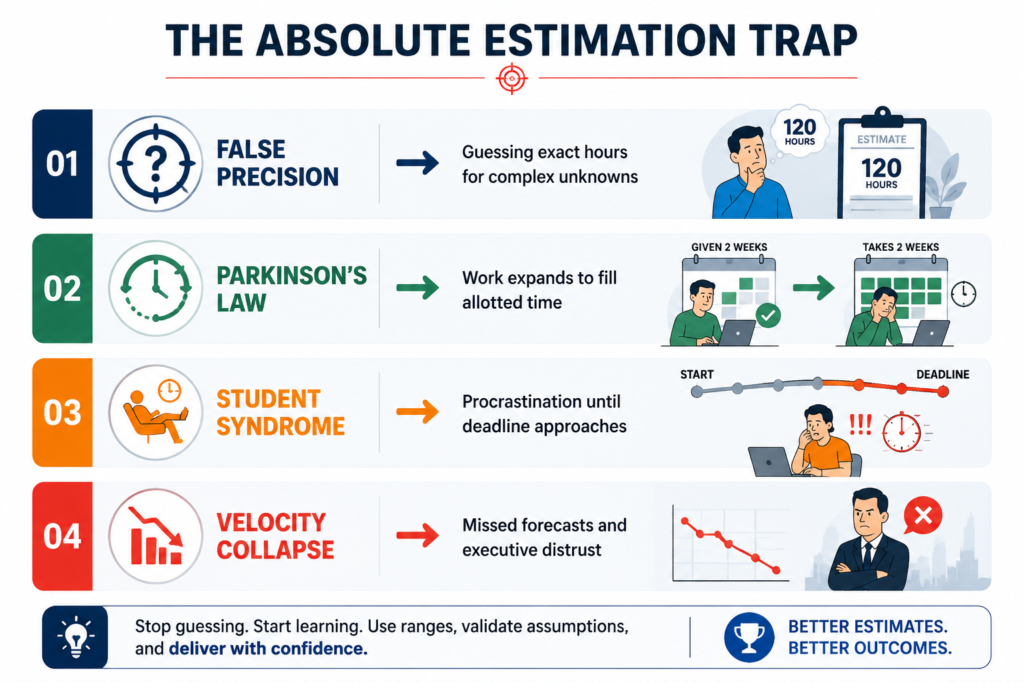
When project managers demand hourly estimates, two psychological forces immediately sabotage the project schedule:
Parkinson’s Law: Work expands to fill the time allotted for its completion. If a developer finishes a 10-hour estimated task in 4 hours, they rarely submit it early. Instead, they polish unnecessary code or pad testing until hour 10.
Student Syndrome: Workers postpone full effort until the final possible moment before a deadline, eliminating any safety buffer intended for unforeseen technical roadblocks.
To escape this trap, world-class organizations have abandoned absolute duration guessing. They rely instead on the foundational principles of Relative Logic.
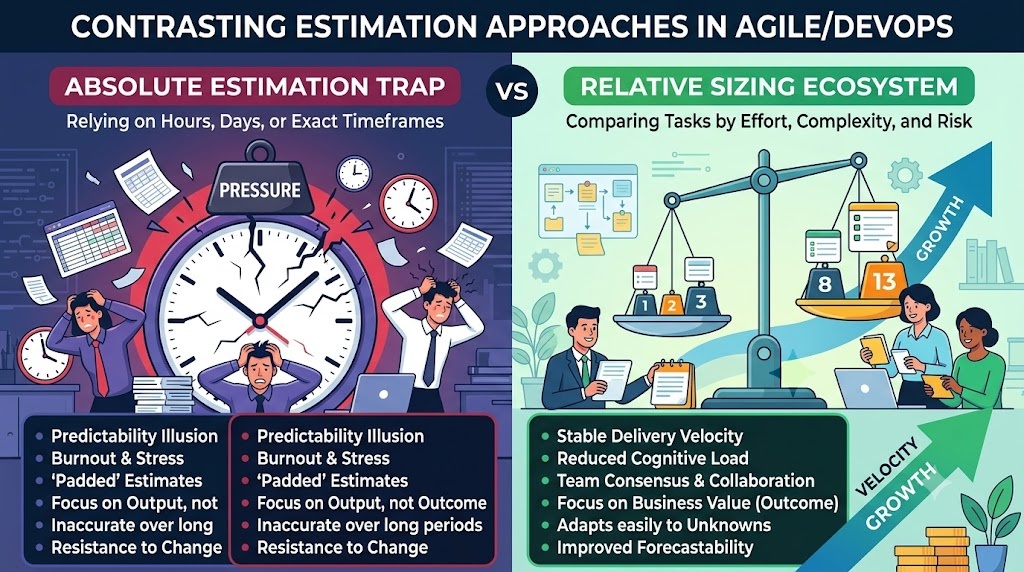
The Science of Relative Logic: Sizing Over Timing
Relative estimation is the practice of evaluating task volume, structural complexity, and inherent uncertainty by comparing work items against one another, rather than assigning arbitrary time values. Instead of asking “How many hours will this take?”, high-performing teams ask “Is this task bigger or smaller than our known reference task?”
Cognitive science explains why this shift works. Human psychophysics demonstrates that while our brains are notoriously terrible at calculating absolute measures without tools, we possess an innate ability for comparative assessment. If you hold two unmarked stones in your hands, you cannot accurately state their absolute weight in grams. However, within seconds, you can identify which stone is heavier with near-perfect consistency.
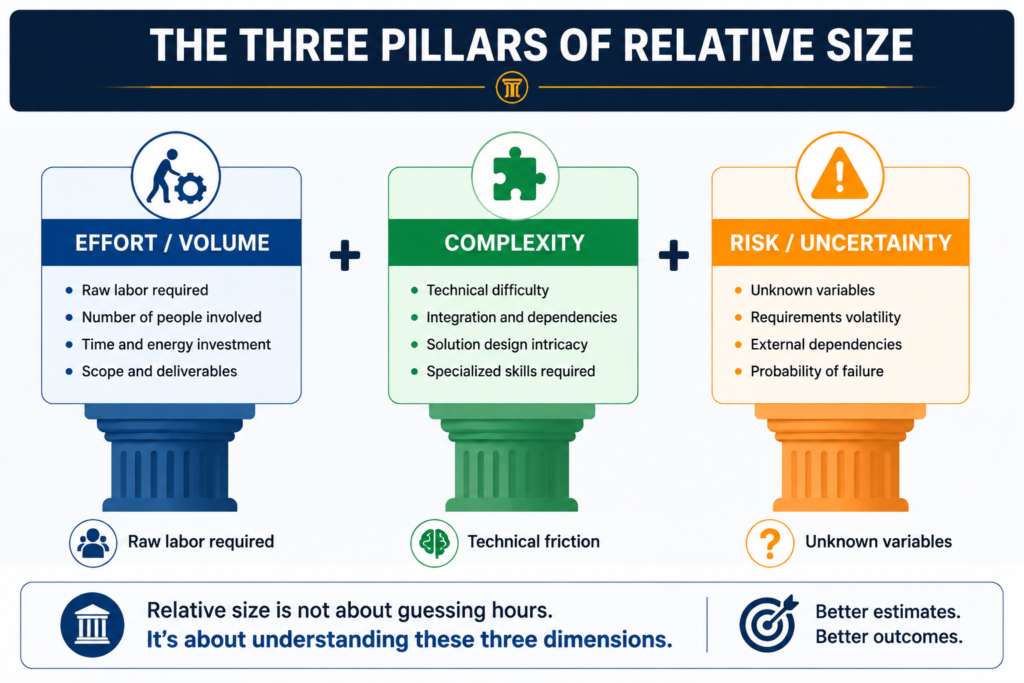
When evaluating work relatively, teams synthesize three distinct variables into a single abstract score:
Effort (Volume): The raw amount of work required to complete the deliverable.
Complexity: The architectural difficulty, structural dependencies, and cognitive overhead involved.
Risk and Uncertainty: The presence of unvalidated requirements, unfamiliar legacy code, or external third-party integrations.
The Weber-Fechner Law and Exponential Scaling
Why do relative estimation frameworks use non-linear sequences like the Fibonacci scale (1, 2, 3, 5, 8, 13, 21)? The answer lies in the Weber-Fechner Law, which establishes that the minimum noticeable difference between two stimuli is proportional to the magnitude of the stimuli.
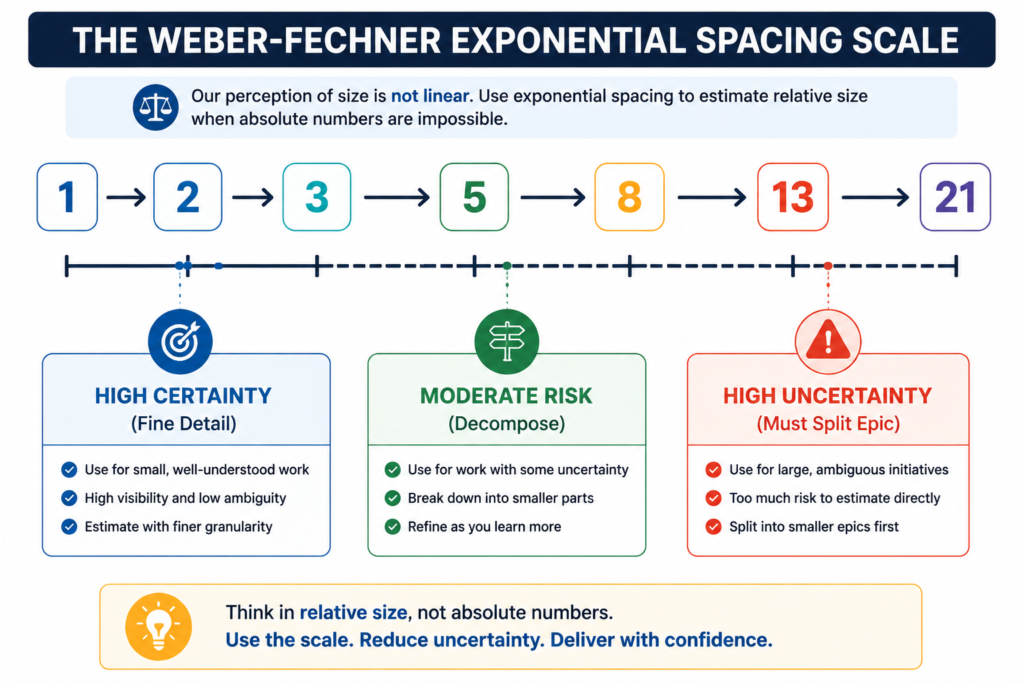
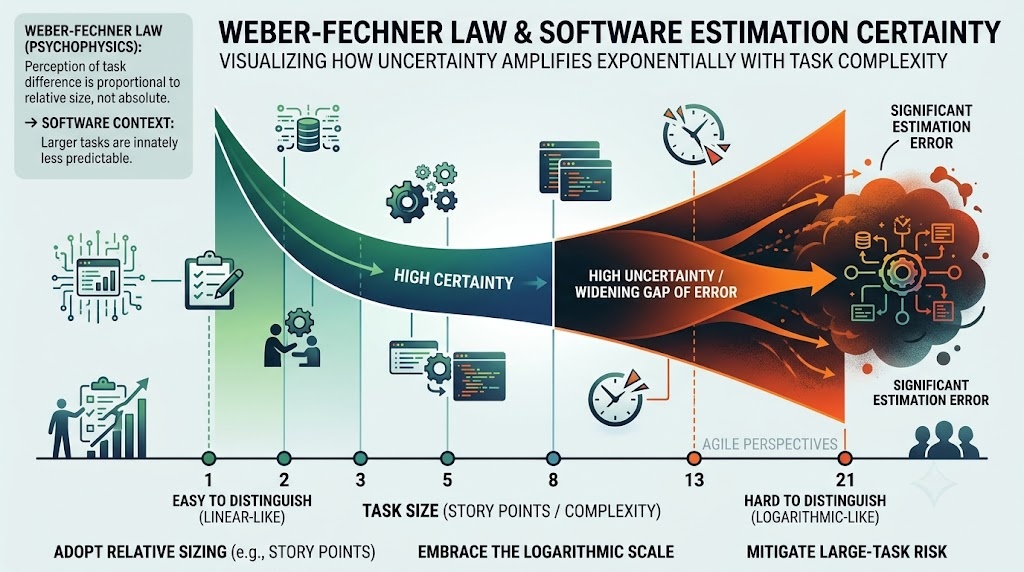
When a task is small, human perception easily distinguishes minor variations. You can readily tell the difference between a 1-point micro-task and a 2-point tweak. However, as task size scales up, fine-grained differentiation becomes impossible. Debating whether a massive legacy database migration is a 14-hour or a 15-hour job is a complete waste of corporate energy.
The Fibonacci sequence forces exponential gaps as size increases. The gap between 8 and 13 is significantly wider than the gap between 2 and 3. This growth encodes uncertainty directly into the scale. If a feature sits between an 8 and a 13, the team cannot hide behind fine-grained numbers; they must choose 13, signaling high risk, or break the item down into smaller, well-understood components.
The Relative Sizing Toolkit: Methodologies Demystified
| Methodology | Best Used For | Scale / Units | Core Mechanism |
| Planning Poker | Sprint refinement & detailed backlog sizing (5-15 items) | Fibonacci Sequence (1, 2, 3, 5, 8, 13, 21) | Consensus-based secret voting to eliminate anchoring bias and surface technical edge cases. |
| T-Shirt Sizing | High-level roadmap planning, epics, and early portfolio intake | XS, S, M, L, XL, XXL | Rapid, low-friction categorization of large initiatives without granular technical overhead. |
| Dot Voting | Backlog prioritization and value-based feature ordering | Distributed physical or virtual tokens | Team members allocate visual tokens to signal relative priority and execution urgency. |
Establishing the Anchor: The Reference Catalog
Relative logic fails if your team lacks a shared point of reference. Showing a developer a new user story and asking “How big is this?” without a baseline leads to confusion. You must establish a Golden Reference Catalog.
Pro Tip: Select a completed, highly understood user story from past sprints and define it as your permanent baseline (e.g., a “2-Point Story”). Every future backlog item is sized strictly in relation to this reference item. Is the new feature twice as complex as our 2-point reference? Then it is a 5. Is it half as complex? It is a 1.
Step-by-Step Implementation Framework for Project Leaders
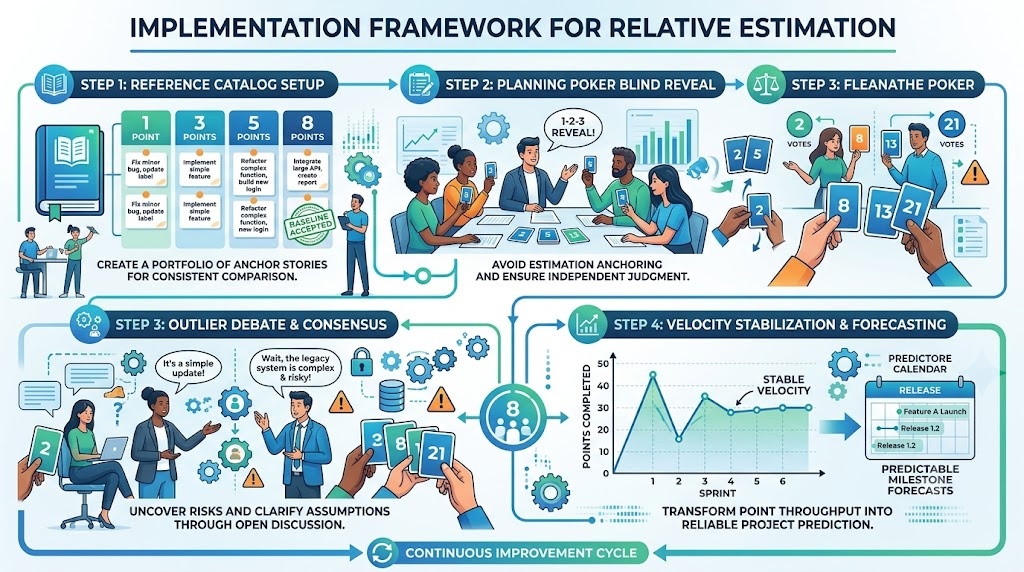
Here is an actionable, battle-tested framework you can implement immediately to transition your delivery team from hourly duration guessing to relative logic precision.
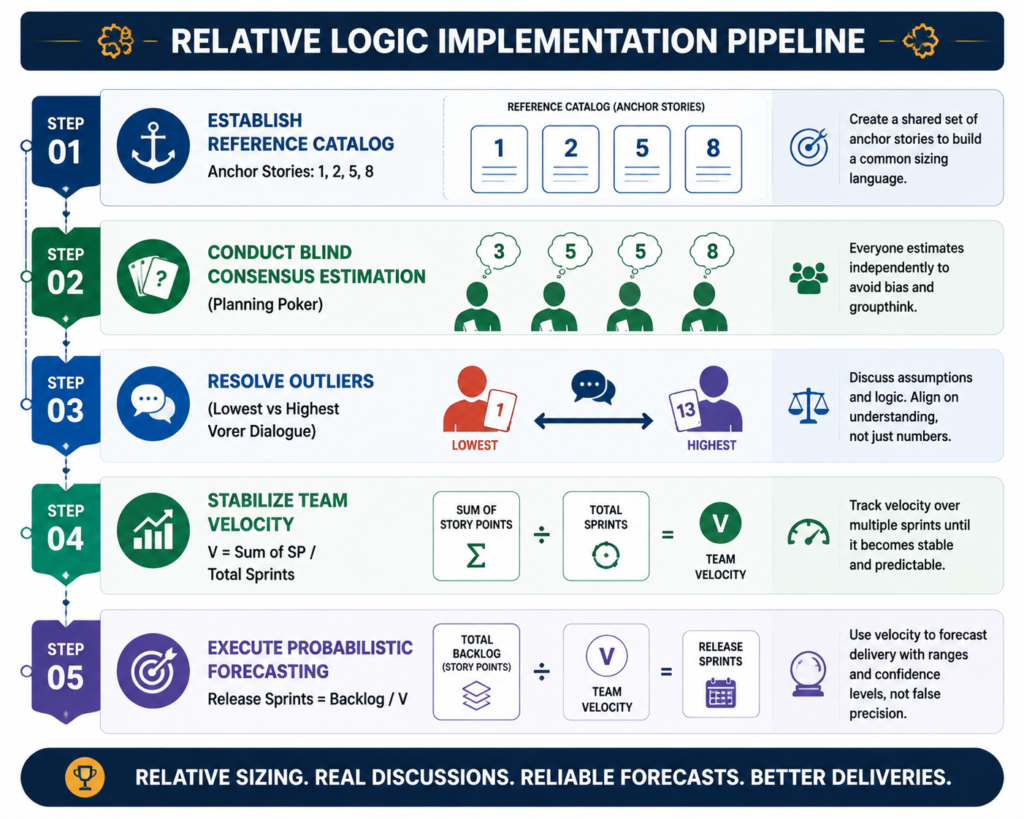
Step 1: Build the Reference Catalog
Gather your delivery team and review work completed over the past quarter. Identify 3 to 4 benchmark items that represent varying degrees of effort, complexity, and testing risk.
1-Point Reference: Updating a static text label, minor configuration changes, or updating a database schema field with known scripts.
3-Point Reference: Adding a standard validated field to an existing form and writing basic integration unit tests.
5-Point Reference: Developing a new, fully responsive UI page integrated with an internal, documented REST API.
8-Point Reference: Building a new third-party payment gateway integration with complex error-handling workflows.
Publish these reference stories permanently in your project wiki or sprint planning board.
Step 2: Conduct Blind Consensus Sessions (Planning Poker)
When refining new backlog items, avoid open verbal guessing. Open verbal estimation introduces Anchoring Bias and the HiPPO Effect (Highest Paid Person’s Opinion), where junior members unconsciously mirror the estimate of the senior architect.
The Product Owner reads the user story and acceptance criteria.
Developers and QA engineers ask clarifying questions regarding scope.
Each team member privately selects a Fibonacci card representing their relative score compared to the reference catalog.
All team members reveal their cards simultaneously.
Step 3: Resolve Outliers Through Focused Dialogue
If the team reveals scores of 3, 3, 5, 3, and 5, consensus is effectively reached; record a 3 or 5 and move on. However, if the reveal shows scores of 2, 3, 3, 5, and 21, stop immediately.
Do not average the numbers. Averaging relative points destroys critical risk signals. Instead, open a two-minute dialogue between the extreme outliers:
Ask the 21-voter first: “What hidden risks, legacy system dependencies, or security edge cases are you seeing that the rest of us missed?”
Ask the 2-voter second: “What existing component, framework, or automation script are you planning to leverage that makes this so straightforward?”
This dialogue routinely uncovers missed architectural risks or elegant reusable components before work begins. After the discussion, re-vote privately. Consensus will emerge naturally.
Step 4: Calculate Velocity and Forecast Probabilistically
Once work items are sized using relative points, project managers calculate Team Velocity, defined as the total number of relative story points completed to the Definition of Done within a sprint cycle.
To calculate average velocity over N completed sprints, use the standard formula:
Where \(SP_i\) represents the total completed Story Points in sprint \(i\), and \(N\) is the total number of completed sprints used to calculate the team's average velocity.
Sample Velocity Stabilization Table
| Sprint Cycle | Committed Points | Completed Points (Done) |
|---|---|---|
| Sprint 1 | 38 | 26 |
| Sprint 2 | 30 | 32 |
| Sprint 3 | 32 | 30 |
| Sprint 4 | 31 | 31 |
| Average Velocity | 32.75 | 30.00 Points / Sprint |
Notice how velocity stabilizes after initial calibration. Once velocity locks into a consistent range (e.g., 30 points per sprint), release forecasting becomes simple arithmetic:
From Firefighting Timekeeper to Elite Delivery Strategist
Consider the profound operational shift when relative logic takes root across your portfolio:
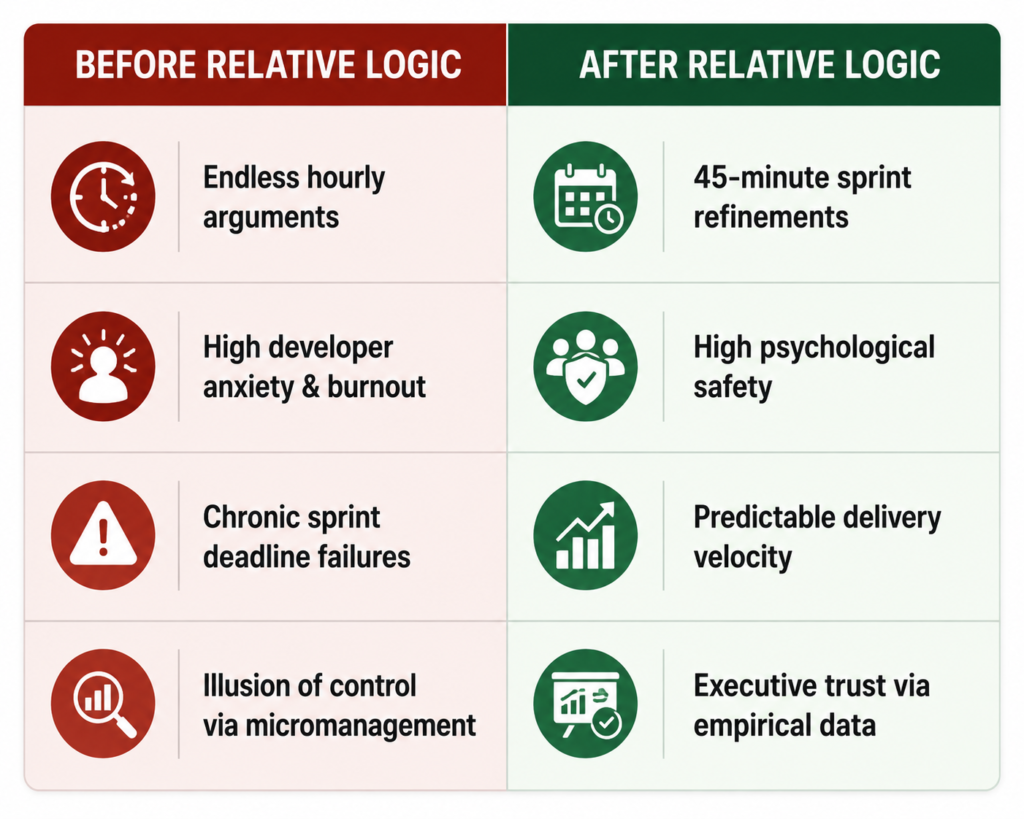
Before Relative Logic: You are locked in endless daily battles over late hourly estimates. Developers feel micromanaged and anxious, leading to burnout. Sprints routinely fail their commitments, scope creep runs wild, and executive leadership views project management as an administrative bottleneck that makes promises it cannot keep.
After Relative Logic: Sprint planning sessions wrapped up in 45 focused minutes. Technical risks are surfaced weeks before code is written. Engineers focus on problem-solving rather than clock-watching. Sprints hit their commitments with quiet, predictable rhythm.
When you master relative estimation, you change how executive leadership perceives your value. You cease to be a passive time-tracker who simply updates Gantt charts and chases late status reports.
Instead, you step into the room as a Strategic Delivery Director: an executive operator who understands cognitive psychology, leverages empirical data, stabilizes operational throughput, and delivers major initiatives on schedule without crushing team morale.
This distinction separates middle managers who remain stuck in mid-level administrative roles from elite project leaders who rise swiftly into senior management, Director of Delivery, and Vice President of Operations positions.
4. ACTION: Master Elite Delivery with Skillsetify
Relative logic is just one piece of the modern project leadership puzzle. Navigating corporate politics, designing resilient governance systems, and scaling high-velocity execution across multi-million dollar portfolios requires more than memorizing textbook definitions. It requires deep operational mastery.
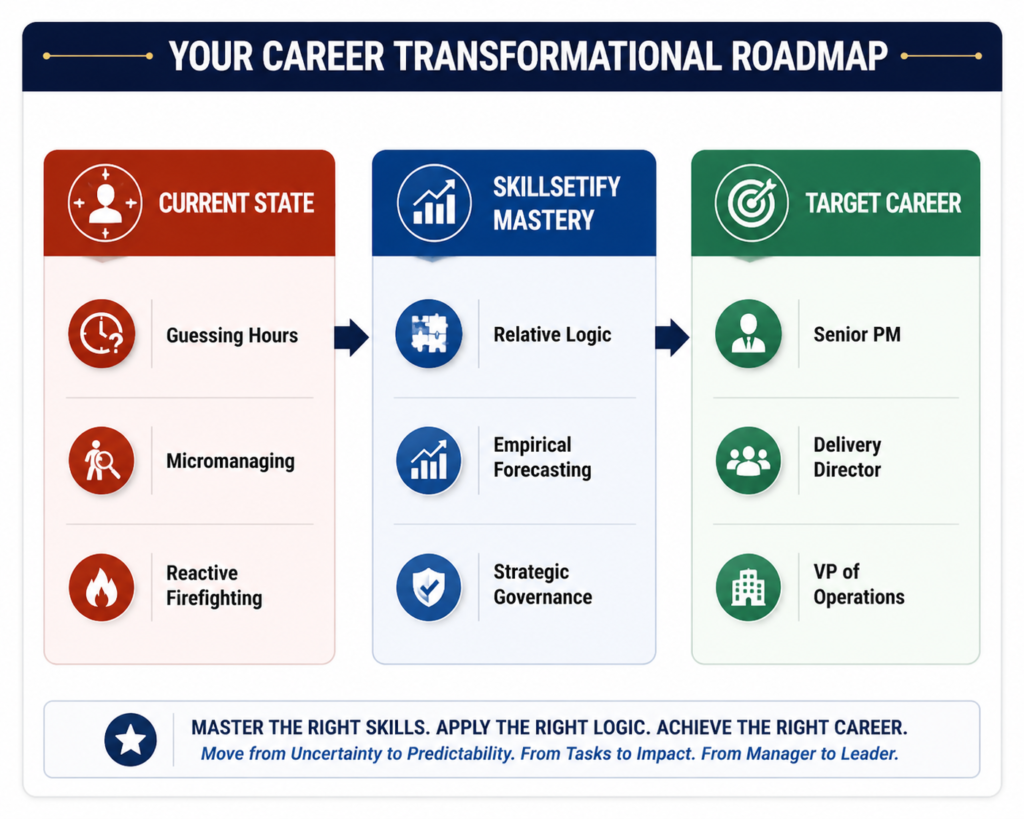
If you are ready to stop guessing, move up the corporate ladder, and learn project management the right way, reach out to Skillsetify. We do not just teach frameworks: we show you your exact career growth trajectory.