Why Confusing Lead Time and Cycle Time Destroys Delivery Predictability
The quarterly executive review at a major financial enterprise had descended into familiar chaos. The Vice President of Product leaned forward, staring at the launch dashboard with visible frustration. “The automated merchant onboarding portal was promised to our key partners for Q3, yet it is running six weeks late. Why did engineering take so long to build this feature?”
The Senior Project Manager immediately pulled up a series of internal burndown charts and replied with supreme confidence: “Actually, our execution velocity was outstanding. The average developer Cycle Time across those integration user stories was just 2.8 days. Our engineering team is moving faster than ever.”
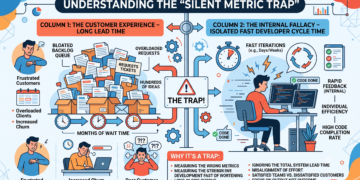
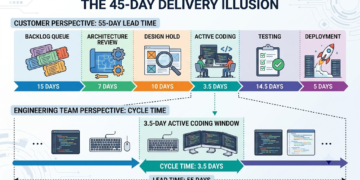
A heavy silence fell over the boardroom. The VP was unimpressed by the sub-three-day statistic, because the commercial reality was stark: forty-two days had elapsed from the moment the business submitted the request into the backlog to the day the software reached production.
This scenario plays out daily in corporate boardrooms worldwide. It stems from a critical misunderstanding of performance analytics: mistaking active execution time for overall delivery duration. When project leaders confuse internal efficiency with customer-facing responsiveness, delivery predictability crumbles, stakeholder trust vanishes, and promising careers hit an abrupt glass ceiling.
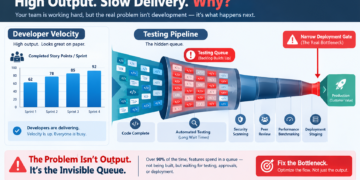
To solve this delivery crisis, project leaders must first dismantle a pervasive corporate myth: the belief that accelerating active execution duration automatically speeds up delivery to the market. In reality, across most complex enterprise product organizations, active work accounts for less than 15% of total elapsed time. The remaining 85% of time is consumed by unmanaged queue idle time, approval bottlenecks, and bloated backlogs.
Decoding Flow Analytics: Lead Time vs. Cycle Time
To establish true operational control, elite project managers separate customer experience metrics from internal execution metrics. This separation centers on the distinction between Lead Time and Cycle Time.
Definitions and Core Mechanics
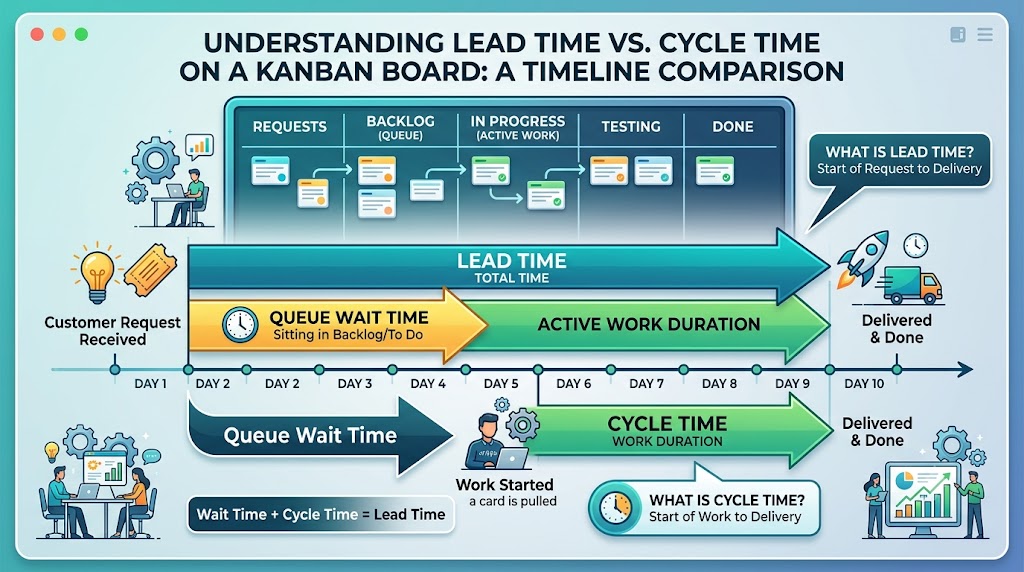
Lead Time represents the total elapsed duration measured from the exact instant a request enters the system (the backlog) to its final delivery into the hands of the end-user or customer. It encompasses every stage of the lifecycle, including initial intake, prioritization, queue waiting periods, active development, quality assurance, and deployment. Lead Time is an external, customer-centric metric. It answers the fundamental stakeholder question: How long must I wait to receive value?
Cycle Time, by contrast, measures the active work execution duration. It begins the precise moment a team member actively begins working on a task (moving it into “In Progress”) and ends when the item fulfills the Definition of Done. Cycle Time is an internal, process-centric metric. It answers the operational question: How efficiently is our team executing active tasks?
The mathematical relationship between these two concepts is straightforward yet profound:
Lead Time = Queue Wait Time + Cycle Time
When teams focus exclusively on Cycle Time, they optimize a small fraction of the total delivery lifecycle while ignoring the massive queue wait times that inflate overall Lead Time.
| Metric Dimension | Lead Time | Cycle Time |
| Measurement Boundary | Backlog Entry $\rightarrow$ Final Customer Hand-off | Active Work Start rightarrow Definition of Done |
| Primary Audience | Executive Leadership, Clients, Business Stakeholders | Engineering Teams, Scrum Masters, Delivery Leads |
| Perspective | External (Customer Experience) | Internal (Process Efficiency) |
| Primary Focus | Market Responsiveness & Time-to-Market | Active Execution Velocity & Execution Flow |
| Optimization Levers | Queue Management, Backlog Pruning, Capping WIP | CI/CD Automation, Technical Pairing, Blocker Removal |
The Mathematical Engine: Little's Law in Project Analytics
To manage performance analytics scientifically rather than reactively, project managers must ground their strategy in queuing theory. The foundational mathematical principle governing workflow dynamics is Little’s Law. In project management, Little’s Law is expressed as:
Work In Progress(WIP) = Throughput x Cycle Time
Rearranging this formula to solve for duration yields:
Lead Time = Work In Progress (WIP) / Throughput
This mathematical reality proves that Lead Time is directly proportional to Work in Progress (WIP). If an organization continuously pushes new initiatives into the backlog without increasing throughput or capping active work, Lead Time increases linearly. You cannot mathematically shorten delivery timelines without actively reducing WIP or clearing queue stagnation.
Visualizing Bottlenecks with Cumulative Flow Diagrams
Understanding the math is step one; visualizing system behavior in real-time is step two. The Cumulative Flow Diagram (CFD) is the premier analytical chart for diagnosing flow health across a Kanban or Agile delivery system.
A well-constructed CFD tracks cumulative work items across various workflow states over time:
Horizontal Distance measures Lead Time. The horizontal gap between the arrival curve (backlog entry) and the completion curve (done) displays the exact duration items spend traveling through the entire system.
Vertical Distance measures Work in Progress (WIP). The vertical gap between bands represents the volume of active tickets sitting in the system at any given moment.
Band Slope represents Throughput or Delivery Rate. A steep, steady upward trajectory indicates healthy, continuous value delivery.
When a CFD displays widening vertical bands in intermediate states (such as “Testing” or “Code Review”), it indicates an unsustainable buildup of WIP. This accumulation inflates local Cycle Times and inflates total Lead Time across the entire department.
The 5-Step Operational Framework for Delivery Analytics
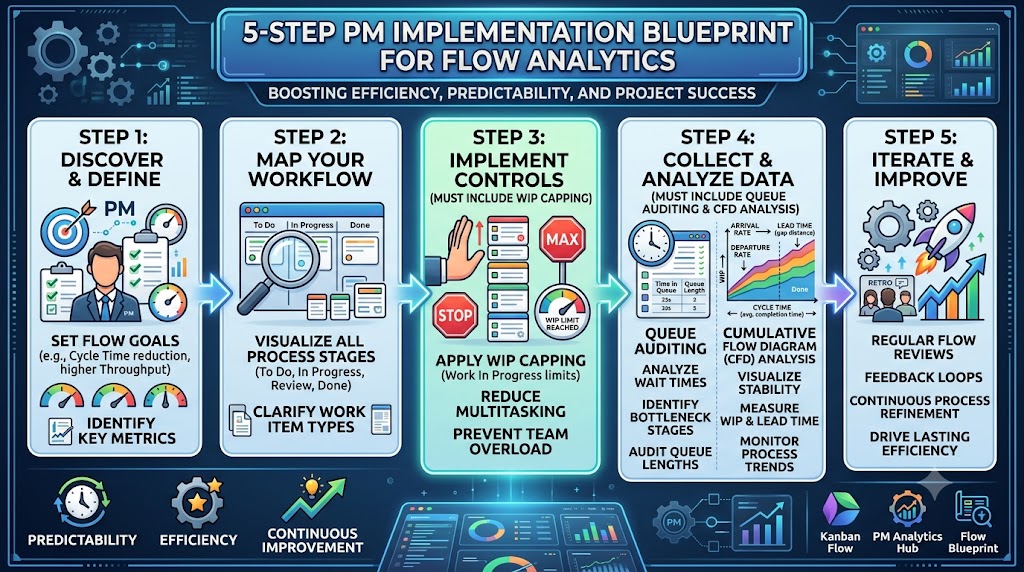
To transition your team from unpredictable fire-fighting to precision delivery, implement this five-step operational blueprint.
Step 1: Establish Explicit Process Boundaries and Handoff Rules
Define clear, unambiguous transition rules for your board columns. Explicitly mark the entry point for Lead Time (e.g., when a ticket passes initial intake review) and the start point for Cycle Time (e.g., when a developer pulls a card into active development). Ensure all team members understand when the clock starts and stops for each metric.
Step 2: Enforce Hard Work-in-Progress (WIP) Limits
Set explicit caps on the maximum number of cards allowed in active work columns. A proven rule of thumb for cross-functional teams is to set WIP limits at 1.5 x Number of Team Members. By capping active work, you stop multi-tasking, eliminate context switching, and force team members to collaborate on completing existing tasks before pulling new work.
Step 3: Instrument Automated Control Charts and Control Limits
Eliminate manual status reports and spreadsheet tracking. Configure digital tools such as Jira, Azure DevOps, or Linear to generate automated Cycle Time control charts. Establish upper and lower control limits (typically set at two standard deviations from the mean). Investigate any single ticket that breaches the upper control limit to uncover systemic root causes.
Step 4: Audit and Prune Stagnant Queue Backlogs
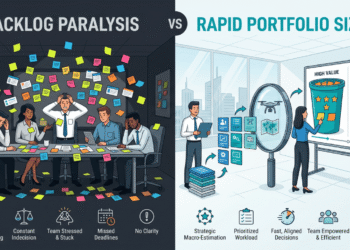
Conduct bi-weekly backlog hygiene audits. Identify any ticket that has resided in an unstarted queue state for more than thirty days. Either ruthlessly archive the request or re-evaluate its priority with business stakeholders. Clearing dead weight from queues directly shrinks system Lead Time.
Step 5: Establish Weekly Cumulative Flow Variance Reviews
Incorporate CFD analysis into weekly delivery cadences. Rather than reviewing individual ticket statuses, examine the slopes and band widths of your CFD. Identify widening bands early, reallocate resources to clear operational bottlenecks, and maintain a consistent, predictable flow.
From Operational Task Tracker to Strategic Executive Leader
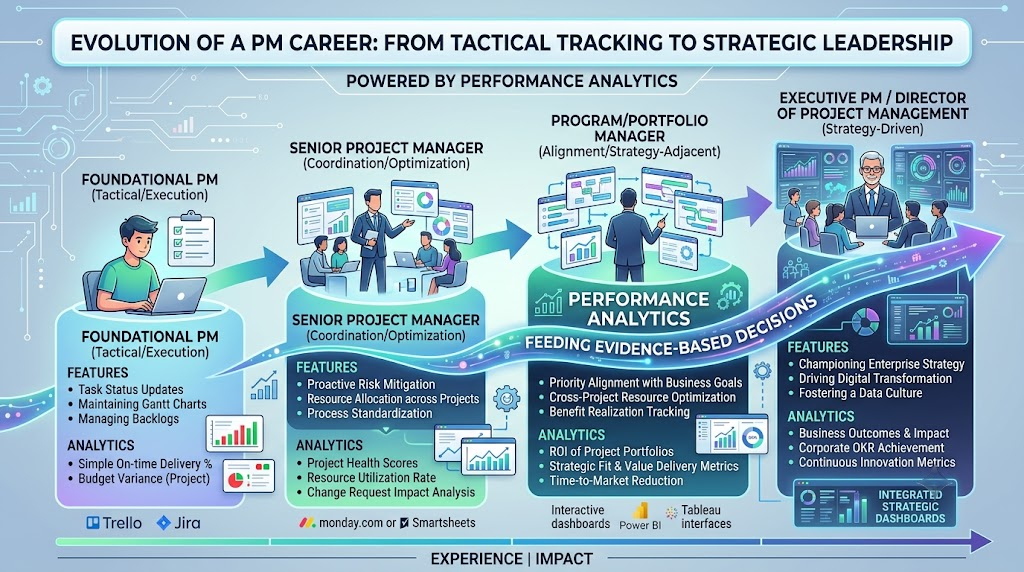
Mastering Lead Time, Cycle Time, and Little’s Law does far more than streamline software deployments: it completely transforms your professional trajectory.
In many enterprises, project managers remain trapped in tactical execution roles. They function as human status aggregators, constantly chasing updates, explaining delays, and absorbing executive frustration. They operate under perpetual stress, battling scope creep, team burnout, and unpredictable schedules.
When you master performance analytics, this dynamic reverses completely. By shifting your narrative from vague percentage updates to empirical flow metrics, you command immediate authority. Instead of apologizing for missed delivery dates, you present executive leadership with data-backed probabilistic forecasts: “Based on our historical 85th-percentile Lead Time, this initiative has an 85% probability of reaching production within 24 business days.”
This quantitative sophistication elevates your standing across the organization. C-suite leaders do not build strategic partnerships with passive task trackers; they align with business leaders who drive operational predictability and value creation.
This operational credibility forms the cornerstone of an elite career networking strategy. When you consistently demonstrate data-driven delivery control, senior executives select you to lead their highest-visibility corporate transformations. You gain direct access to executive steering committees, cross-functional strategy groups, and high-impact industry panels. This visibility builds a powerful network of executive sponsors, accelerating your career advancement into senior director, VP, and Chief Operating Officer trajectories.
Elevate Your Project Leadership with Skillsetify
Navigating modern project analytics requires more than superficial framework knowledge: it demands a deep, quantitative mastery of value flow, organizational dynamics, and strategic communication. Differentiating Lead Time from Cycle Time is your first step toward building an unbreakable reputation for delivery excellence and strategic leadership.
If you are ready to stop guessing, move up the corporate ladder, and learn project management the right way, reach out to Skillsetify. We do not just teach frameworks: we show you your exact career growth trajectory.