Why Confusing Lead Time and Cycle Time Is Killing Your Delivery Velocity
Consider a high-stakes executive board meeting on a stressful Monday morning. The Vice President of Product presents a gleaming dashboard showing a 35 percent reduction in engineering ticket turnaround time over the past quarter. By all internal accounts, the development team is executing faster than ever. Yet, enterprise clients are threatening to cancel multi-million dollar contracts due to missed release windows and creeping delivery schedules. Account managers report that critical feature requests sit untouched in backlog queues for two months before a single software developer opens a ticket.
This operational friction stems from a systemic corporate misunderstanding: confusing Cycle Time with Lead Time. Executives demand market responsiveness, project managers measure active execution, and clients demand final outcomes. When leadership fails to distinguish between the duration work takes in active execution and the total duration a request exists within the enterprise system, organizational performance degrades rapidly.
A pervasive corporate myth suggests that accelerating internal developer velocity or engineering output automatically translates to faster business value delivery. In reality, optimizing technical execution while ignoring upstream queues is equivalent to tuning a high-performance engine inside a vehicle stuck in gridlocked traffic.

Deconstructing Flow Metrics: Lead Time versus Cycle Time
To build a predictable, high-performing delivery organization, project managers and operational leaders must clearly delineate total elapsed duration from active execution duration.
Understanding Lead Time
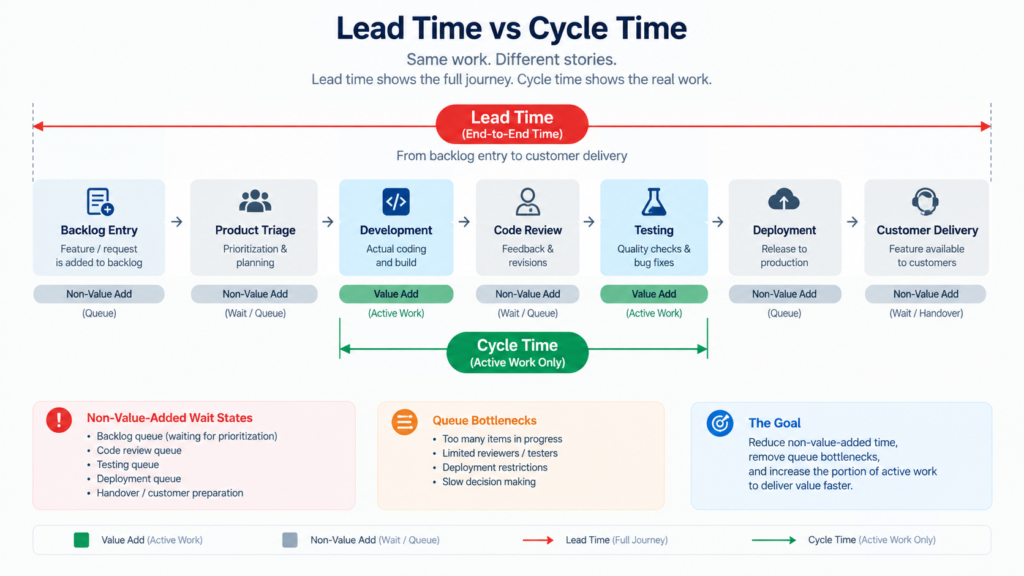
Lead Time represents the macro perspective of the value stream. It is the total elapsed calendar time from the precise moment a stakeholder or customer submits a formal request to the exact moment that request delivers operational value in production.
Because Lead Time captures the full customer experience, it measures organizational responsiveness. It answers a fundamental business question: How long must a client wait to receive value after placing an order or requesting a system change?
The scope of Lead Time encompasses the entire end-to-end journey:
-
Initial customer request entry and backlog logging
-
Business analysis, scope refinement, and legal or compliance reviews
-
Prioritization buffering and resource scheduling queues
-
Active software development, engineering, or manufacturing execution
-
Quality assurance testing, security auditing, and user acceptance validation
-
Deployment pipelines, release buffers, and operational sign-offs
Understanding Cycle Time
Cycle Time represents the micro perspective of technical execution. It measures the elapsed time from the moment a team actively begins working on a task to the moment that task reaches completion.
Cycle Time measures team-level operational efficiency. It answers an internal management question: Once work is pulled into active development, how quickly can the delivery team execute?
By isolating active execution from pre-work queuing time, Cycle Time provides a clear view of team productivity, technical friction, and execution bottlenecks.
The Non-Value-Add Reality: Wait Time and Queues
The structural difference between Lead Time and Cycle Time is Wait Time. In unoptimized enterprise environments, work spends the vast majority of its lifecycle sitting idle in queues, waiting for approvals, handoffs, or available capacity.
To quantify this dynamic, elite project managers utilize the Process Cycle Efficiency metric:
In typical enterprise software and project operations, Process Cycle Efficiency often hovers below 10 percent. This means over 90 percent of total Lead Time consists of non-value-added waiting time. Reducing active coding time by two days yields negligible customer impact if the feature sits in a backlog queue for sixty days prior to commencement.
Little's Law and the Mechanics of Flow
Understanding the mathematical relationship between work queues and execution velocity requires applying Little’s Law, a foundational principle of queuing theory:
When project teams flood their workflow with excessive Work in Progress, Cycle Time expands exponentially. Uncontrolled task switching, cognitive context-switching, and resource contention degrade throughput, causing upstream backlog queues to back up and exploding total Lead Time across the enterprise.
The Executive Implementation Framework: A 5-Step Operational Playbook
Transitioning an organization from metric confusion to flow optimization requires a disciplined, empirical framework. Project managers can deploy the following five-step playbook immediately to streamline delivery pipelines and eliminate hidden delay buffers.
Step 1: Define Explicit System Boundaries and Commitment Points
Before tracking performance metrics, establish clear workflow boundaries across your digital tracking tools.
The Entry Point: The exact point where a user request, market requirement, or feature idea is logged into the system backlog.
The Commitment Point: The formal boundary where leadership agrees to deliver a feature, moving it from candidate status to committed backlog. Lead Time measurement formally commences here.
The Active Work Start Point: The column where an engineer or team member pulls a ticket into active status. Cycle Time measurement formally commences here.
The Fulfillment Point: The boundary where the feature is released to live production and value is realized by the end customer. Both Lead Time and Cycle Time measurements cease here.
Step 2: Establish Strict Work-In-Progress (WIP) Limits
To control Cycle Time and prevent queue overload, enforce explicit WIP limits across every active stage of your workflow board.
Cap the maximum allowable cards in active execution columns based on team capacity.
Enforce a pull-based work model where team members only pull new work from the committed queue when capacity becomes available.
Eliminate the practice of assigning multiple simultaneous high-priority tasks to single team members.
Step 3: Implement Cumulative Flow Diagrams (CFDs) and Control Charts
Move beyond basic average duration metrics by utilizing advanced visual analytics.
Cumulative Flow Diagrams: Monitor the vertical distance between workflow bands. Expanding bands indicate rising Work in Progress and growing queues, signaling immediate downstream bottlenecks.
Cycle Time Scatterplots: Analyze distribution trends across work items. Identify multi-modal peaks that reveal systemic blockers or inconsistent task sizing.
Step 4: Conduct Process Cycle Efficiency Audits
Identify and systematically eliminate non-value-added waiting periods across your value stream.
Audit ticket histories to map active execution duration against idle queue duration.
Identify recurring handoff delays between functional silos, such as handoffs between development, quality assurance, and deployment operations.
Automate regression testing, security scans, and deployment pipelines to compress downstream validation buffers
Step 5: Establish Percentile-Based SLA Benchmarks
Replace misleading average metrics with statistical percentiles when setting delivery expectations with business stakeholders.
Utilize 85th and 95th percentile completion metrics derived from historical Lead Time data.
Communicate delivery commitments probabilistically, stating, for example, that 85 percent of requests land in production within fourteen days.
Eliminate arbitrary target dates based on gut feelings, replacing them with empirical forecasting models.
Shifting from Chaos to Predictable Elite Delivery
Organizations that master the distinction between Lead Time and Cycle Time experience a profound operational transformation. The symptoms of delivery dysfunction, such as perpetual status meetings, chaotic firefighting, scope creep, and team burnout, dissipate.
When project managers focus on reducing total Lead Time by eliminating queue idle time rather than pushing teams to work faster during active Cycle Time, workflow dynamics stabilize:
Predictable Delivery Cadences: Stakeholders gain accurate, data-backed visibility into feature delivery dates, fostering trust across business units.
Sustainable Operations: Development and engineering teams work within controlled WIP limits, reducing cognitive overhead and technical debt accumulation.
Strategic Value Alignment: Management effort shifts from monitoring internal task execution to optimizing end-to-end customer value streams.
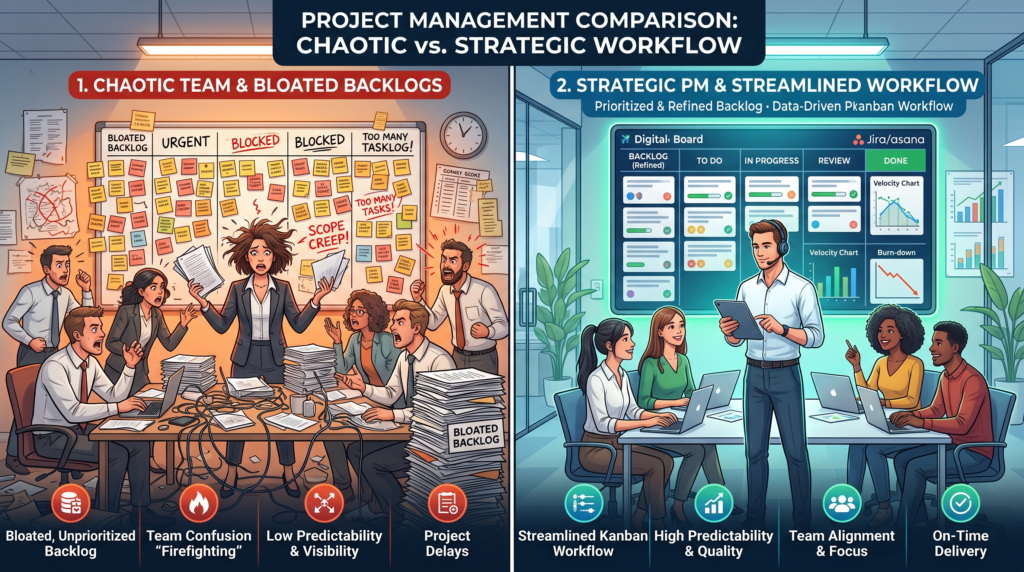
This operational evolution directly impacts a project manager’s professional trajectory. In modern enterprise environments, administrative status aggregators who merely report missed deadlines are rapidly being replaced by automation. Conversely, strategic leaders who understand performance analytics, queue mechanics, and flow optimization become indispensable business assets.
Mastering project performance metrics elevates your corporate standing. When you demonstrate the ability to diagnose systemic bottlenecks, optimize resource allocation, and accelerate business throughput, senior executive leadership takes notice. Translating operational delivery into measurable financial value marks the boundary between middle management and executive advancement.
Master Project Performance Analytics with Skillsetify
Optimizing Lead Time and Cycle Time is not merely a theoretical exercise in metrics: it is the operational engine that powers world-class organizations. By looking beyond superficial developer velocity and addressing systemic queue delays, forward-thinking project managers unlock true enterprise agility and build predictable, high-performing teams.
If you are ready to stop guessing, move up the corporate ladder, and learn project management the right way, reach out to Skillsetify. We do not just teach frameworks: we show you your exact career growth trajectory.