Why Confusing Lead Time and Cycle Time Is Quietly Killing Your Delivery Velocity
Picture this board meeting. The Chief Commercial Officer slams his notebook on the conference table. An enterprise client paying seven figures annually is threatening to terminate their contract. Why? A critical software feature requested eight weeks ago has still not hit production.
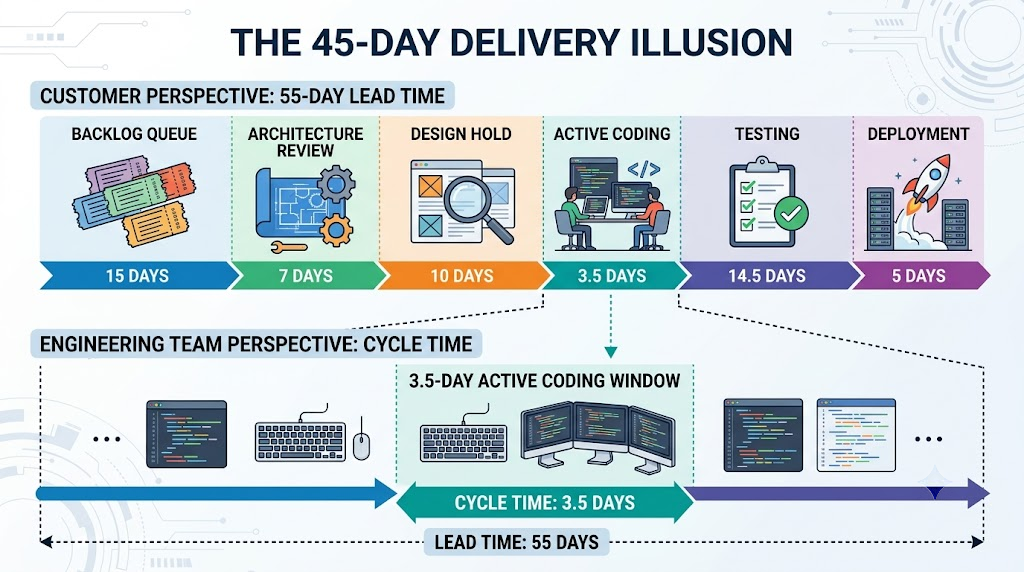
The CCO turns to the Vice President of Engineering and demands an explanation. The VP of Engineering, looking baffled, opens Jira and pulls up the telemetry. He points directly to the board metrics: “I do not understand the outcry. Our engineering cycle time on that specific ticket was exactly 3.5 days. Our developers completed the work in record time!”
The room falls into tense silence. Both executives are looking at the exact same delivery pipeline, yet they are measuring two completely different realities.
The feature spent 52 days sitting in an unrefined product backlog, waiting for design approvals, architecture sign-offs, and prioritization reviews. Once an engineer finally dragged the card to “In Progress,” the technical execution took under 84 hours.
To the customer and the CCO, delivery took 55 days. To engineering, it took 3.5 days.
This classic workplace meltdown stems from one of the most pervasive myths in modern corporate operations: To deliver faster, engineering teams simply need to write code faster.
In reality, active technical execution accounts for less than 15% of the total duration a request spends inside an enterprise delivery system. The remaining 85% is dead time: work sitting idle in queues, blocked by cross-functional handoffs, or buried under unmanaged backlog piles. When leadership focuses exclusively on execution speed while ignoring system queues, they end up optimizing a tiny fraction of the process while the business bleeds client trust.
Deconstructing Performance Analytics: Lead Time vs. Cycle Time Defined
To diagnose delivery friction, set realistic SLAs, and eliminate client frustration, project managers and delivery leaders must explicitly differentiate between these two core metrics.
Lead Time: The Customer Experience Benchmark
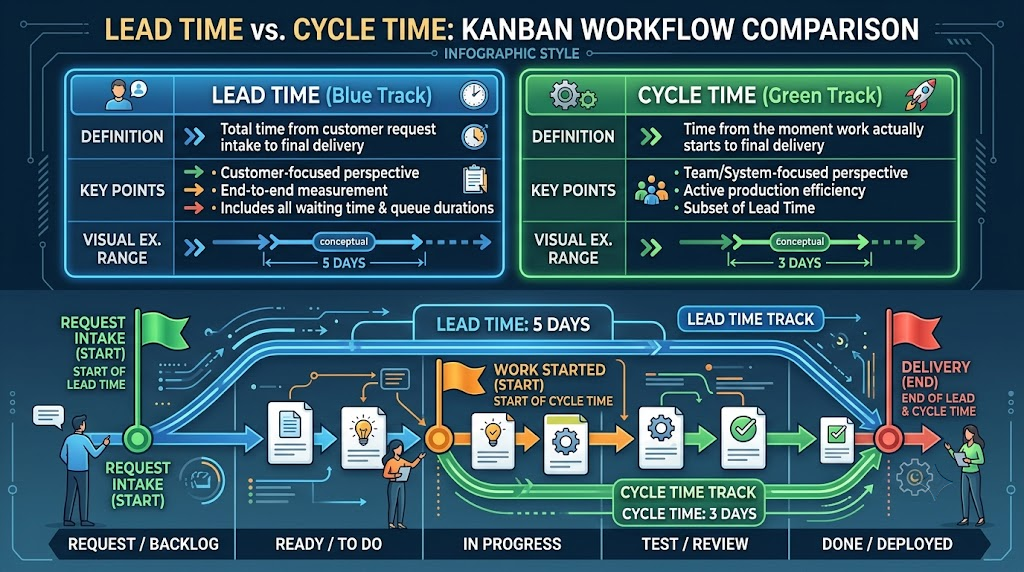
Lead Time measures the total elapsed duration from the exact moment a work request is introduced into the system (or committed to by the team) to the moment it is fully delivered into the hands of the end user.
Perspective: External (Customer, Client, Business Stakeholder).
Clock Starts: When an item enters the backlog queue or receives formal intake commitment.
Clock Stops: When the deliverable is deployed, validated, and operational in production.
Key Components: Request intake delay + Queue waiting time + Active execution time + Deployment and verification time.
Primary Objective: Measures organizational responsiveness, value delivery, and market agility.
Cycle Time: The Operational Execution Benchmark
Cycle Time measures the duration spent actively working on a task once technical execution has officially begun. It reflects internal processing efficiency and team throughput.
Perspective: Internal (Engineering, QA, Technical Implementation Teams).
Clock Starts: When a team member pulls a task into “In Progress” or active work status.
Clock Stops: When technical work passes acceptance testing and reaches a “Done” or “Ready for Release” state.
Key Components: Active hands-on work duration + internal review and testing wait states.
Primary Objective: Measures process efficiency, technical stability, and execution capacity.
| Attribute | Lead Time | Cycle Time |
| Primary Focus | Total turnaround time from request to fulfillment | Operational execution duration for active work |
| Stakeholder Angle | Customer and Business Value viewpoint | Internal Team and Process Efficiency viewpoint |
| Formula | Lead Time = Delivery Date – Request Intake Date | Cycle Time = WorkCompleted Date – Work StartedDate |
| Primary System Component | Dominated by queue time and waiting states | Dominated by active processing and immediate handoffs |
| Optimization Focus | Queue reduction and backlog refinement | Work-In-Progress (WIP) reduction and task simplification |
The Mathematical Engine: Little's Law and Workflow Mechanics
Understanding these metrics conceptually is only the first step. Elite project managers master the mathematical laws that govern workflow dynamics.
Little's Law in Modern Operations
Originating in queuing theory by MIT Professor John Little, Little’s Law provides the mathematical foundation for flow metrics in knowledge work. In a stable delivery system, the relationship between Work In Progress (WIP), Throughput, and Cycle Time is defined by the formula:
Alternatively, when expressed from a total system intake standpoint:
This mathematical reality exposes an undeniable operational truth: If you want to reduce Cycle Time and Lead Time, you must limit Work In Progress (WIP). Pushing more work into an active system without increasing throughput mathematically forces Cycle Time to balloon.
Reading Cumulative Flow Diagrams (CFDs) to Uncover Invisible Queues
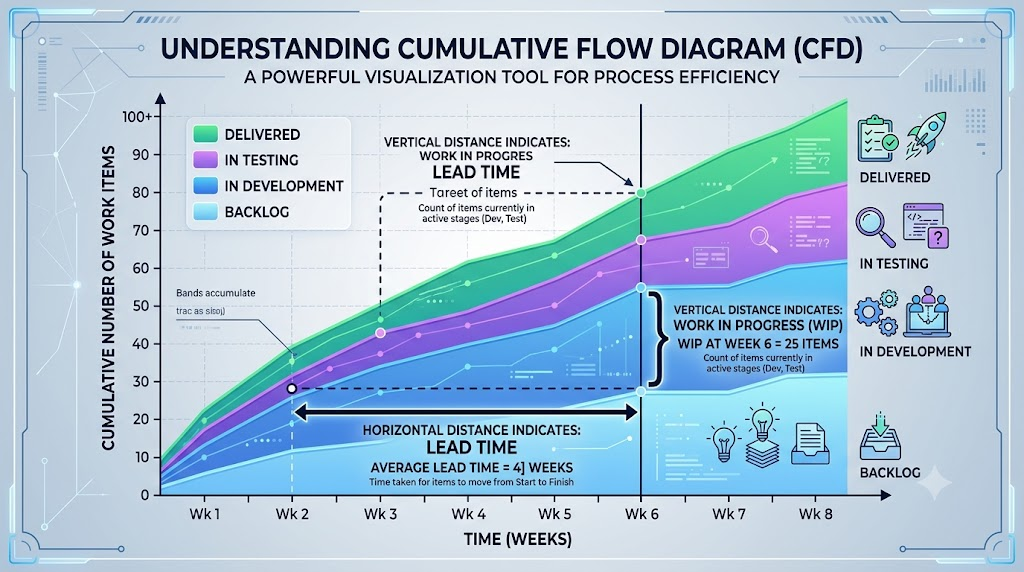
A Cumulative Flow Diagram (CFD) is the ultimate visual analytics tool for diagnosing delivery flow. It tracks the cumulative volume of work items in each workflow state over time.
Horizontal Band Width: Represents the Lead Time (or Cycle Time) for work items moving through the system.
Vertical Band Height: Represents the total volume of Work In Progress (WIP) at any given point in time.
Diverging Lines: If the “Backlog” or “Testing” band widens vertically over time, it indicates an inflating queue where incoming work exceeds processing capacity, directly expanding Lead Time.
Flatlining Bands: A flat line in the “Done” band signals an active operational blockage downstream, halting value delivery to the client.
Step-by-Step Implementation Framework: Operationalizing Flow Metrics
If you want to immediately establish predictability and eliminate queue latency in your organization, follow this four-stage operational playbook:
Step 1: Map Explicit System Boundaries and Commitment Points
Before calculating metrics, your team must define exact entry and exit criteria.
Define the Order Entry Point: Establish when a ticket officially enters Lead Time tracking (for example, when approved during intake triage, not when drafted as a raw idea).
Define the Commitment Point: Specify the exact column where work transitions from backlog queue to team commitment (for example, “Ready for Dev”). This marks the boundary where Lead Time waiting ends and active Cycle Time begins.
Define the Delivery Point: Determine when the clock stops (for example, feature verified in live environment).
Step 2: Implement Strict Work In Progress (WIP) Limits
Prevent team overload and context switching by enforcing hard constraints on active items.
Calculate Team Capacity: Set a starting WIP limit using the baseline formula: WIP Limit = Team Size x 1.5
Enforce Pull-Based Execution: Prohibit team members from pulling new tasks from the queue until an existing task moves to “Done” or testing.
Handle Blocked Tasks: If a task is blocked, keep it in the active WIP column with a visual “Blocked” tag rather than moving it back to backlog, ensuring the team stays focused on unblocking it.
Step 3: Measure and Optimize Flow Efficiency
Flow Efficiency reveals how much of your total Lead Time is spent on value-adding active execution versus non-value-adding waiting. Calculate it using the formula:
Flow Efficiency = (Average Cycle Time / Average Lead Time ) x 100%
Industry Baseline: Most enterprise organizations operate at an abysmal 10% to 15% Flow Efficiency.
Target Benchmark: High-performing delivery teams achieve 30% to 40%+ Flow Efficiency by eliminating handoff delays, automated testing queues, and approval bottlenecks.
Step 4: Conduct Bi-Weekly Flow Reviews Using Scatterplots
Analyze Cycle Time Scatterplots: Review completed items on a percentile distribution (50th, 85th, and 95th percentiles) rather than relying solely on simple averages.
Set Service Level Expectations (SLEs): Establish target operational SLAs based on historical performance (for example, “85% of our tasks complete in 6 days or less”).
Audit Aging Work: Focus retrospectives on work items exceeding the 85th percentile Cycle Time mark to address root causes before delays escalate.
From Firefighting Chaos to Predictable Strategic Delivery
When you shift your organization’s focus from tracking raw developer output to optimizing system flow, the workplace dynamic transforms completely.
The endless operational firefighting, unexpected milestone slips, and team burnout dissolve. Instead of making defensive excuses during quarterly business reviews, you present precise probabilistic forecasts backed by mathematical data. You no longer tell executive leadership that a project will take “about two months.” You state with confidence: “Based on our historical Monte Carlo throughput simulation, this deliverable has an 85% probability of shipping within 18 business days.”
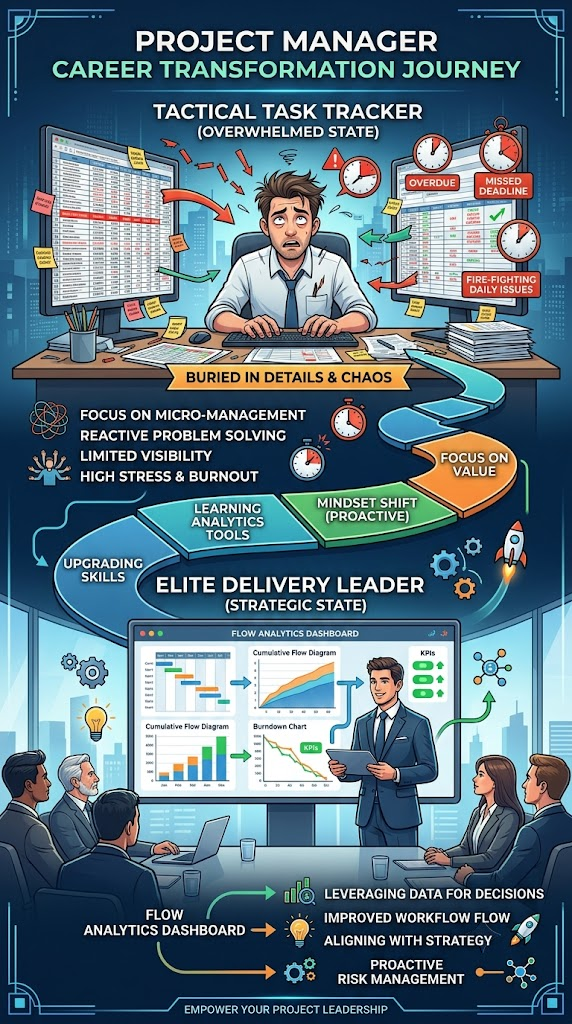
This shift elevates your role within the enterprise. You transition from a tactical task tracker who pushes Jira cards into a strategic business enabler who systematically unlocks enterprise capacity. Managing performance analytics with precision is what separates order-takers from high-impact corporate leaders.
Master Performance Analytics and Elevate Your Career
Navigating complex delivery environments requires moving beyond legacy management practices and mastering real-world performance analytics. Understanding metrics like Lead Time, Cycle Time, and Little’s Law is the foundation for building resilient, high-performing teams that consistently deliver business value.
If you are ready to stop guessing, move up the corporate ladder, and learn project management the right way, reach out to Skillsetify. We do not just teach frameworks: we show you your exact career growth trajectory.
Take charge of your career trajectory and transform into an elite delivery leader by connecting with Skillsetify today.