Why Burn-Up Charts Are Your Only Protection Against Sneaky Scope Creep
It is late on a Friday afternoon, and the executive suite is tense. A high-stakes digital transformation project is nearing its final milestone, or so everyone thinks. The engineering team has been crushing their sprints, delivering dozens of story points like clockwork. Yet, the finish line keeps moving. The leadership team is furious: “We have delivered everything we committed to, so why are we still three months away from release?”
The project manager points helplessly to a traditional burn-down chart. The line is dropping, but it refuses to hit zero. The problem is a classic corporate blind spot. The team was furiously building, but the product stakeholders were quietly and continuously inflating the project scope.
This crisis exposes a deeply entrenched corporate myth: the assumption that a project running behind schedule is always a team velocity or productivity problem.
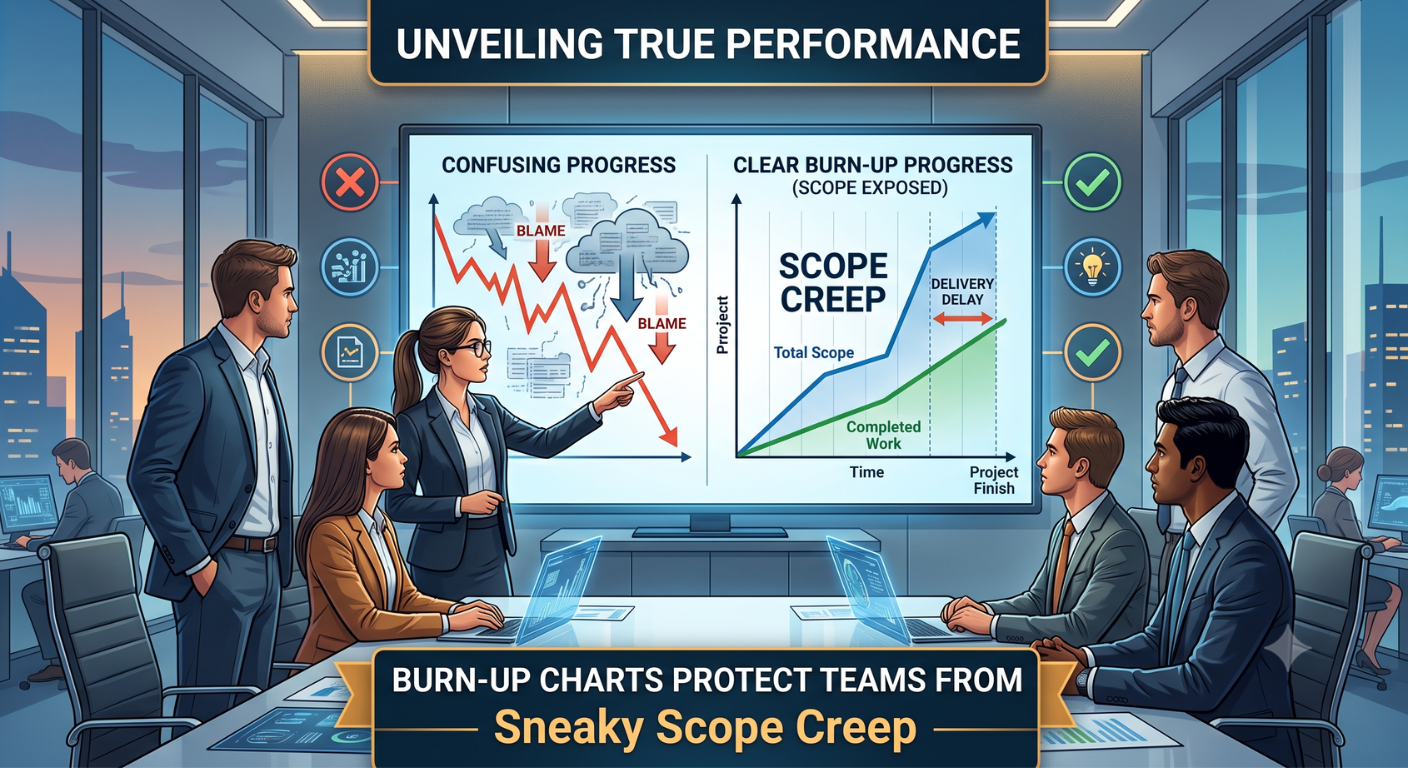
In reality, projects frequently miss deadlines not because engineering slowed down, but because the target itself moved. When you track progress using metrics that blend productivity and scope into a single line, you become blind to reality. If you want to stop the finger-pointing, protect your team from burnout, and give your leadership absolute clarity, you must master Burn-Up Progress Tracking.
Deconstructing Agile Performance Tracking: What Is a Burn-Up Chart?
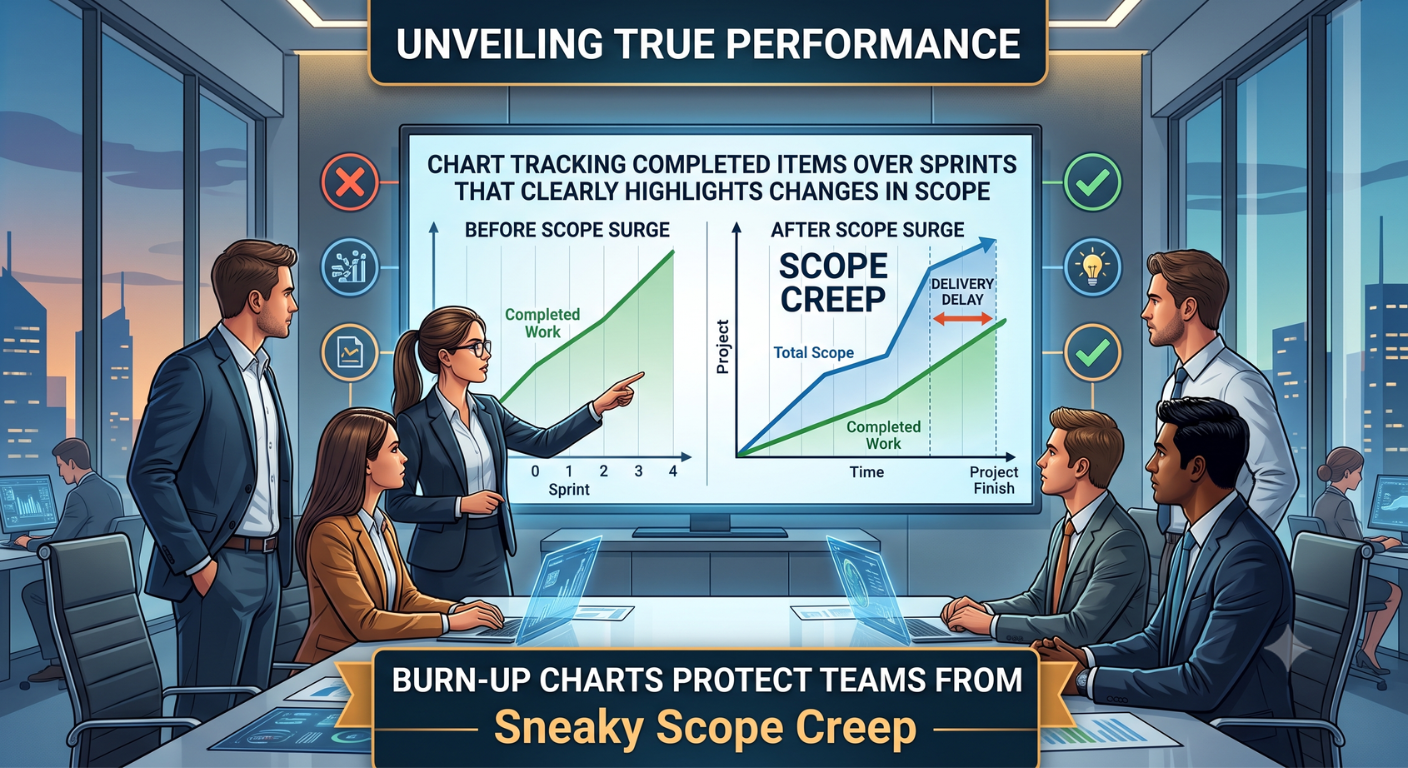
To manage what you measure, you must use a data visualization tool that isolates variables. While traditional methods obscure background changes, a burn-up chart illuminates them by tracking two distinct metrics over time:
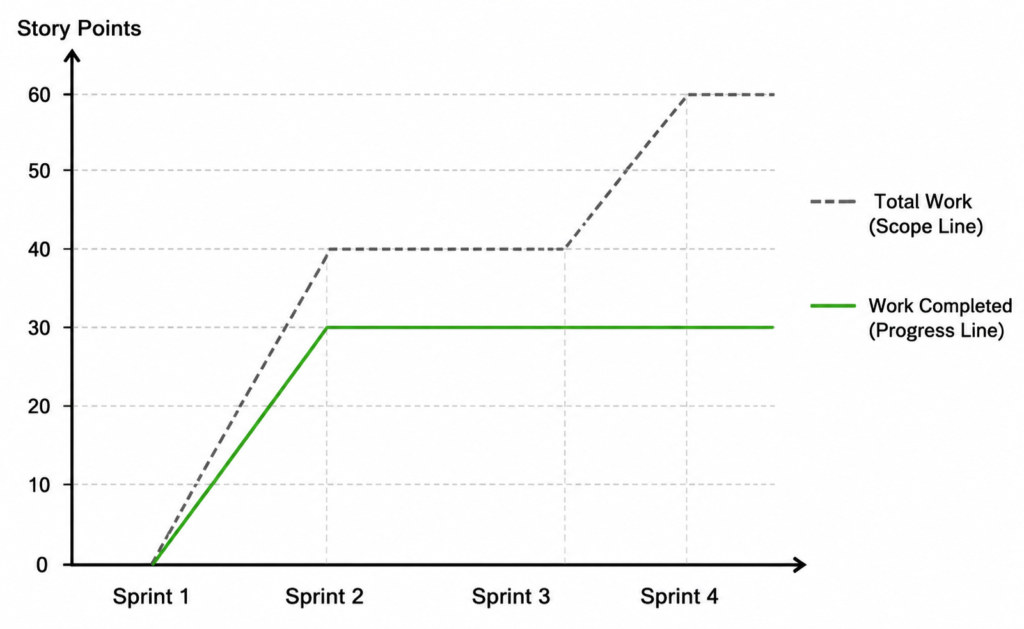
Total Work (The Scope Line): The cumulative sum of all story points or requirements currently approved for the project or release.
Work Completed (The Progress Line): The cumulative sum of all story points successfully delivered by the team across successive sprints.
The chart plots time on the horizontal axis (sprints or weeks) and effort on the vertical axis (story points or completed items).
Why Burn-Up Charts Excel Over Burn-Down Charts
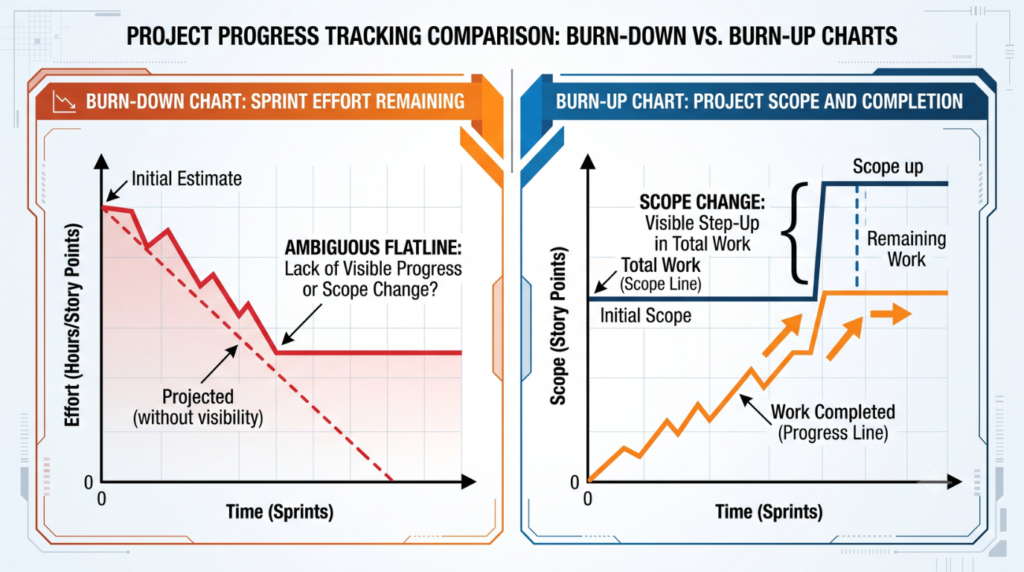
A standard burn-down chart excels at answering one simple question during a single sprint: “Are we going to finish what we promised by the end of these two weeks?” It shows a single line moving downward toward zero.
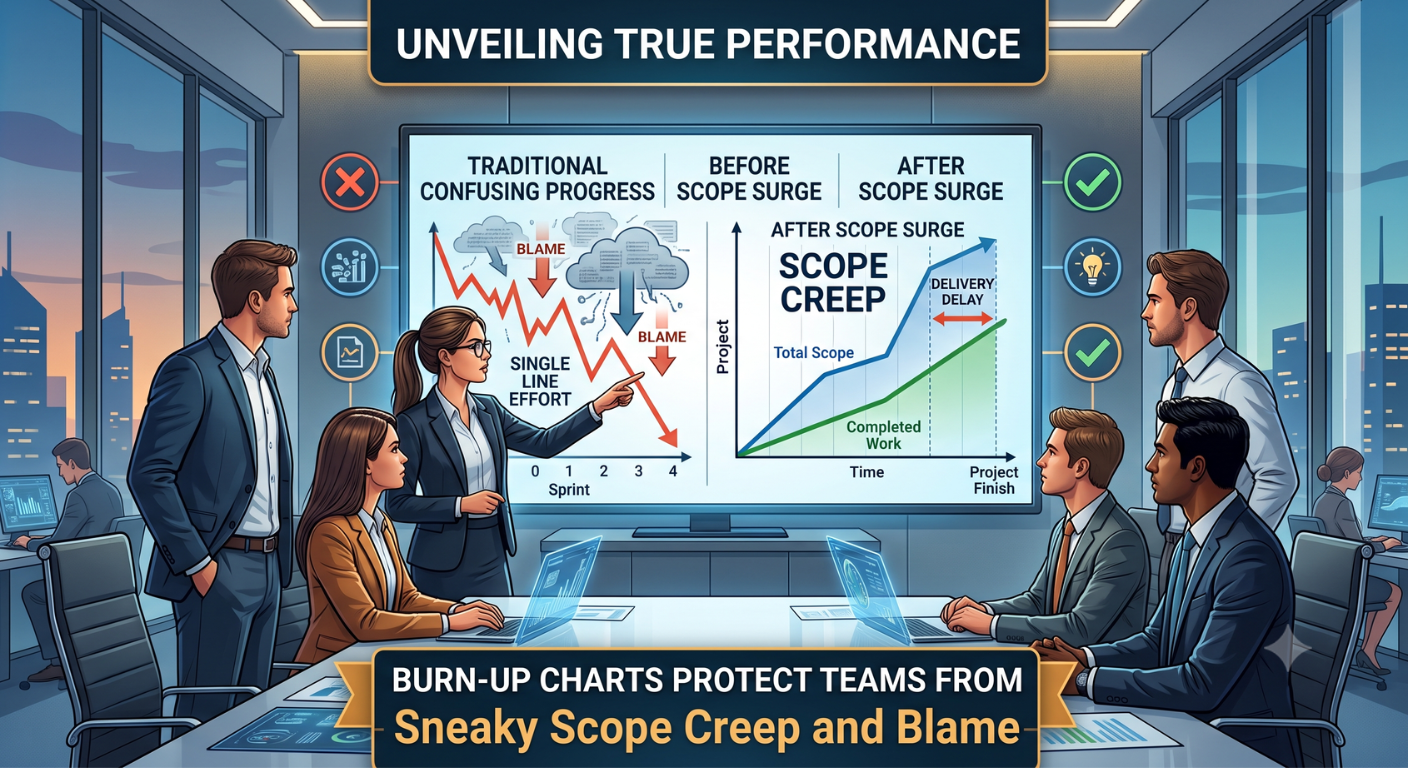
However, when applied to long-term releases or entire project lifecycles, a burn-down chart fails. If the line flattens, you cannot tell if the team stopped coding or if the product manager added five new features.
The burn-up chart solves this flaw by splitting the data into two lines. If scope is added, the top line steps upward. If the team delivers work, the bottom line climbs. The vertical gap between the two lines represents the remaining work.
The Ultimate Implementation Framework for Project Managers
Transforming your performance tracking from reactive damage control to predictive strategy requires a systematic approach. Follow this execution framework to integrate burn-up progress tracking into your workspace.
Step 1: Base Your Tracking on a Stabilized Hierarchy
Before drawing a single line on a chart, your requirements must be cleanly organized. You cannot build an accurate chart on vague data. Ensure your backlog follows a structured breakdown:
Themes: Large focus areas or strategic pillars.
Epics: Distinct, substantial components within a theme.
Features: Functional capabilities contained within an epic.
User Stories: Small, actionable requirements written from a persona’s perspective.
Step 2: Establish the Initial Baseline
At the beginning of your release cycle, aggregate the total story points of all estimated items in your release backlog. Plot this value as your starting point on the Y-axis for Sprint 0. Draw a straight, horizontal line across the chart to represent your initial Total Work Baseline.
Step 3: Map Cumulative Sprint Delivery
At the conclusion of every sprint review, count only the user stories that meet your team’s strict Definition of Done (DoD).
Add the completed story points to the previous sprint’s total.
Plot this value on the chart for the current sprint.
Connect the dots to build your Work Completed Line.
Never plot partially completed stories; tracking is strictly binary to preserve data integrity.
Step 4: Record Scope Adjustments Immediately
When a product owner adds new features or expands existing user stories, recalculate the total release points. Adjust your Total Work Line upward at the exact sprint interval where the change occurred. If features are removed or descoped, drop the line downward.
Step 5: Perform the Convergence Projection
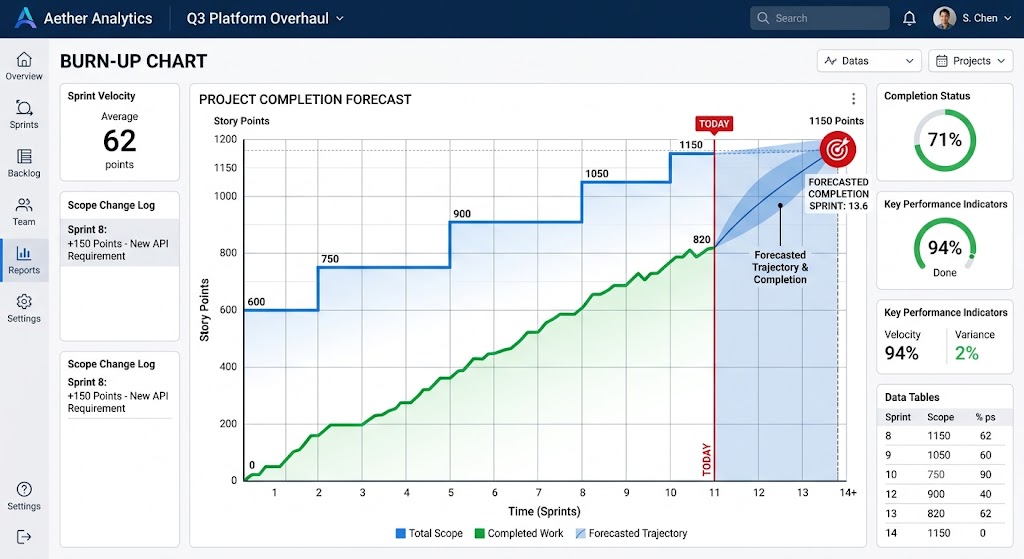
To forecast your actual completion date, project the trajectories of both lines forward. The point where the rising Work Completed Line intersects with the Total Work Line reveals your true delivery date.
| Metrics to Analyze | Chart Visual Cue | Root Cause Diagnosis | Actionable Remedy |
| Diverging Paths | Total Work line steps up while Progress line remains at a steady slope. | Active scope creep driven by unmanaged stakeholder requests. | Enforce strict change-control or swap out low-priority features to preserve the deadline. |
| Parallel Plateau | Both lines flatten completely across multiple sprints. | Systemic blockers, team dependencies, or environment downtime. | Run a root-cause analysis in the next retrospective to clear engineering impediments. |
| Converging Lines | Progress line climbs steadily toward a stable Total Work line. | Highly predictable, elite team execution with disciplined scope management. | Maintain current sprint velocity and plan downstream release activities with high confidence. |
The Professional Transformation: From Chaos to Predictable Delivery
Shifting your tracking methodology completely changes the dynamic of your project ecosystem. When you introduce a dual-line performance tracking system, you change how your team operates and how leadership views your capability.
1. Eliminating the Team Blame Game
When a project falls behind, developers are often unfairly blamed for low productivity. A burn-up chart changes that dynamic by making unmanaged scope visible. It clearly proves to stakeholders that the engineering team is meeting expectations, but the expanding requirements are shifting the deadline. This objective data protects team morale and fosters psychological safety.
2. Enabling Dynamic Data-Driven Trade-Offs
When a product owner insists on adding an urgent feature mid-project, you no longer have to respond with an absolute “no.” Instead, you can pull up the burn-up chart and demonstrate the immediate impact visually. By drawing the scope line upward, you can show exactly how many sprints the deadline will slip unless an equal number of story points are descoped. This changes emotional debates into rational, data-driven decisions.
3. Boosting Leadership Trust and Executive Standing
Executives value predictability and transparency above all else. Presenting a chart that clearly separates team velocity from scope adjustments proves that you possess a strategic grasp of project mechanics. This level of reporting elevates your reputation from a tactical coordinator to an elite business leader who can steer complex initiatives through corporate uncertainty.

Mastering Elite Project Leadership
Relying on outdated tracking models leaves your projects vulnerable to hidden changes and sudden budget crises. True performance tracking requires clear metrics that protect your delivery team and inform your executive stakeholders. By implementing burn-up progress tracking, you bring absolute transparency to your delivery process, address scope changes early, and make your project delivery highly predictable.
If you are ready to stop guessing, move up the corporate ladder, and learn project management the right way, reach out to Skillsetify. We do not just teach frameworks: we show you your exact career growth trajectory. Our expert-led programs give you the advanced, real-world tools needed to navigate complex organizational landscapes and lead high-performing teams with confidence. Turn project data into your greatest professional asset, and accelerate your career with Skillsetify today.